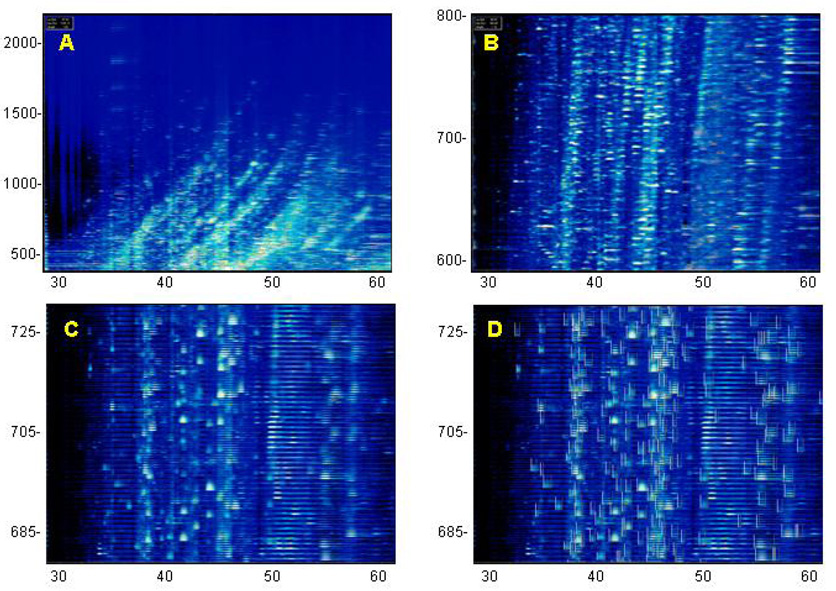
Figure 4.
CE-MS analysis from a human urine sample performed on a Beckman PACE800 CE System interfaced with a Waters LCTpremier mass spectrometer. Mass (in Da) per charge is indicated on the left, migration time (in min) is indicated on the bottom. Panel A shows all signals obtained from 30 – 60 min, m/z 400 – 2200. Panel B shows the signals in the m/z range from 500 – 800. Panel C is a further magnification, data from m/z 680–730 are shown. Signals that were identified as relevant by MosaiquesVisu (z > 1, signal-to-noise ratio >4, present in >3 consecutive spectra) are indicated by boxes in Panel D.

