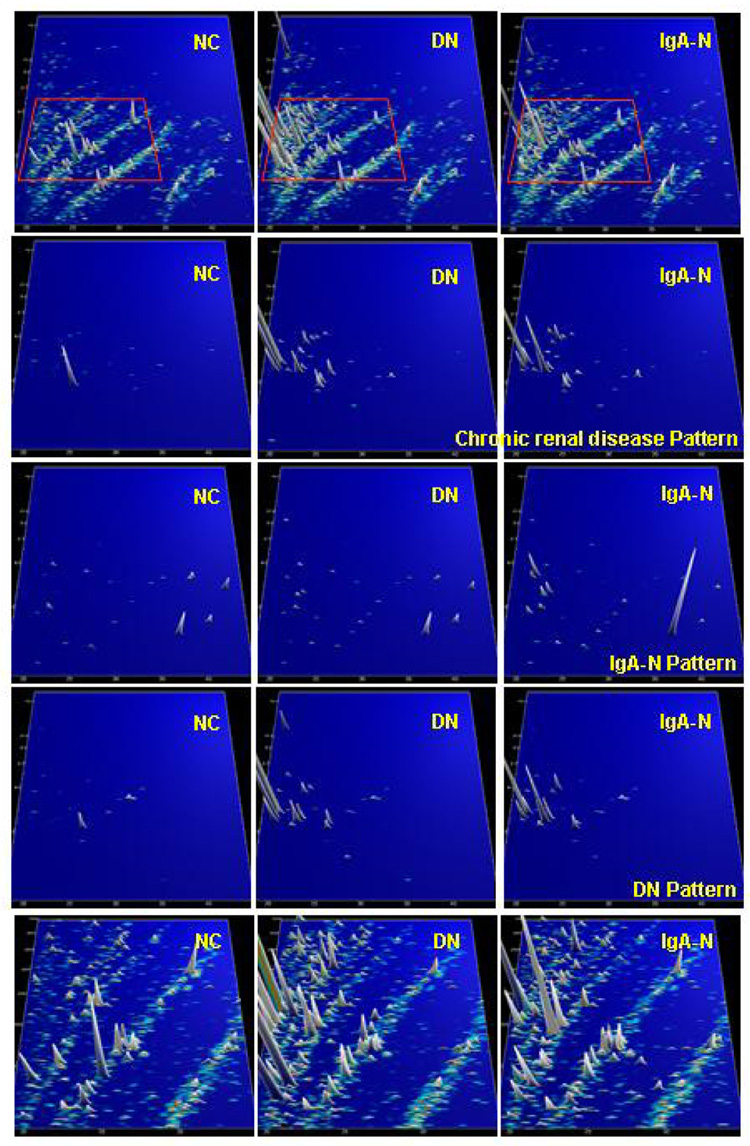
Figure 7.
Protein patterns of healthy volunteers (NC), and patients with diabetic nephropathy (DN) and IgA nephropathy (IgA-N), respectively. Upper panel: compiled patterns consisting of 20 to 100 single measurements, molecular mass (0.8–25 kDa, on a logarithmic scale) against normalized migration time (18–45 min), peak height and color encode the signal intensity. Three middle panels: only selected candidate disease-specific biomarkers are displayed on the same scale. An array of general biomarkers for kidney disease present in DN and IgA-N can be defined. In addition, biomarkers that are specific for DN or IgA-N can be identified, as indicated on the right-hand side. Lower panel: zoom of the upper patterns (all peptides analysed, 1.5–5 kDa, 19–35 min). As evident, several additional biomarkers (of mostly lesser statistical value) are present, which can be further exploited. Reprinted with permission from (Mischak et al., 2007b).

