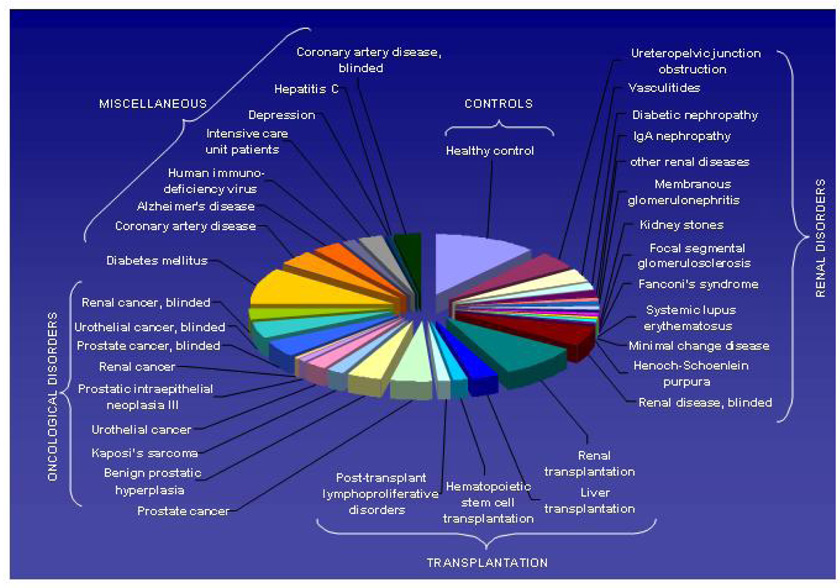
Figure 9.
Graphic depiction of comparable datasets (analyzed with identical pre-analytical preparation, instruments, and analytical parameters) obtained from subjects with different diseases/(pathological) conditions currently represented in the human urinary proteome database. Reprinted with permission from (Coon et al., 2008).

