
Figure 1. SDS-PAGE separation of different prostatic disease EPS urine pools.
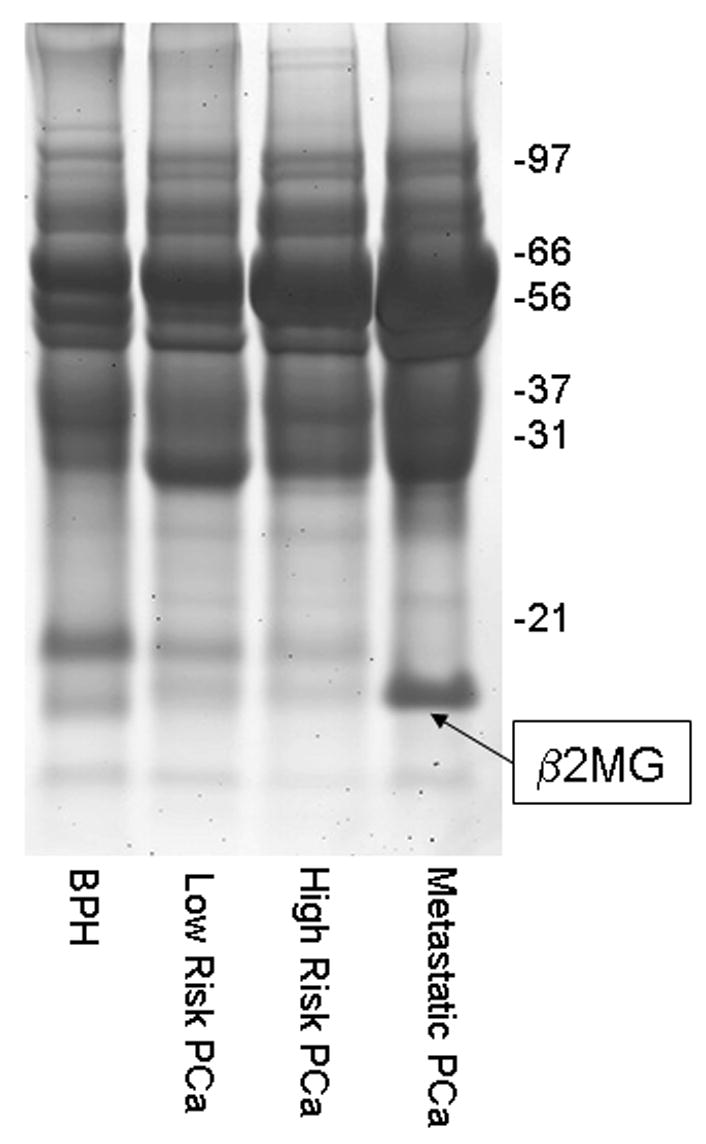
Individual EPS urine sample pools (n=6) representative of BPH, low risk prostate cancer (PCa), high risk PCa and metastatic PCa conditions were generated by 10X concentration through a 5000 MW Amicon cut-off filter (Millipore). Protein loading was normalized to 20 ug total protein per pool, and separated on a 12% Bis-Tris NuPAGE SDS-gel (Invitrogen) visualized by silver staining (Invitrogen). The indicated protein band at 17 kDa was identified by LC-MS/MS as β-2-microglobulin (β-2-MG; Mascot score of 1264), essentially as described in the legend to Table 1.