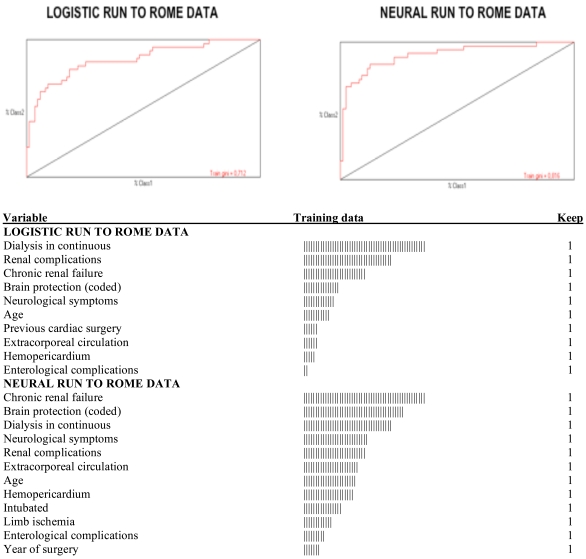
Fig. (1).
ROC plots are given in the top graphs, as derived from the Rome data, respectively by logistic and neural network models with a semiquantitative graphic presentation of the model-specific relevance of the covariates, always among Rome patients (training data). Keep=1 means the covariate may stay in the model. Note that Gini’s coefficients are 0.712 and 0.816 for logistic and neural network model, respectively.

