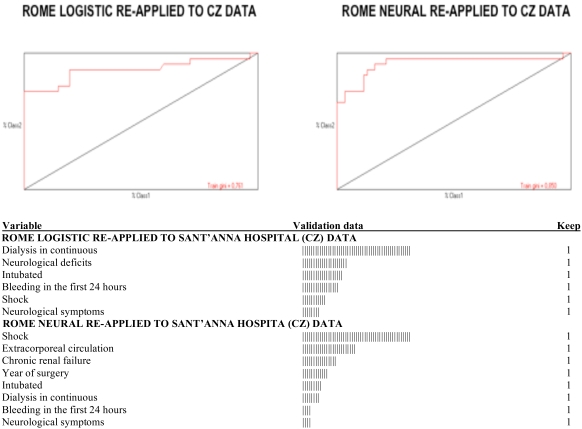
Fig. (2).
ROC plots are given in the top graphs, as derived from the Rome models, respectively logistic and neural network. A semiquantitative graphic presentation is provided for Training/Validation data relevance when re-applied to S. Anna Hospital, Catanzaro (CZ) data. Keep=1 means the covariate may stay in the model. Note that Gini’s coefficients are 0.761 and 0.850 for logistic and neural network model, respectively, which is much better than what seen in Fig. (1).

