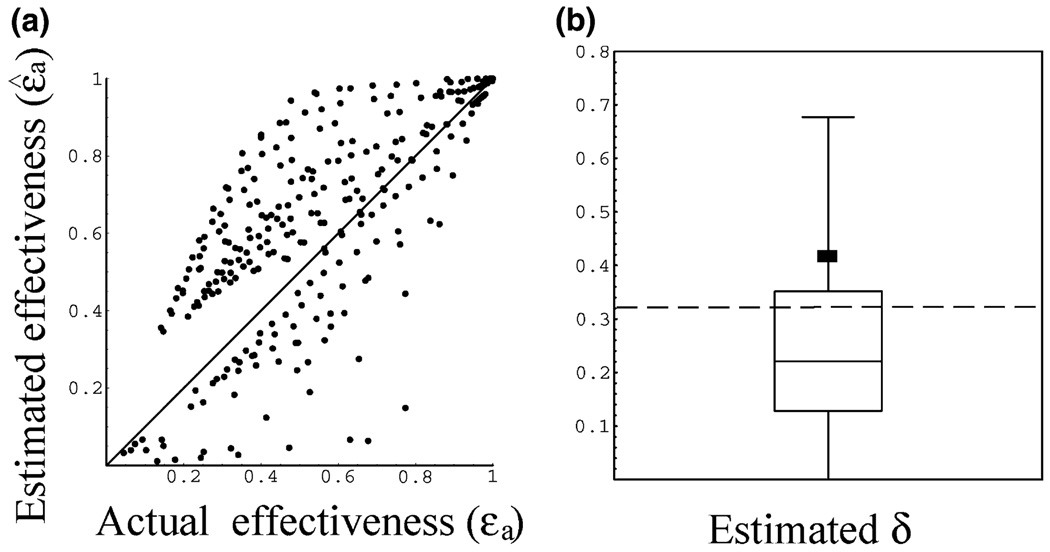
Fig. 2.
(a) The estimated average effectiveness ɛ̂a, obtained by fitting the CE model to the surrogate data, plotted against the actual effectiveness used to generate the data εa. (b) Estimates of the infected cell loss rate, δ̂, obtained using the CE model. The dashed line indicates the true value of δ (0.32/day). The horizontal line within the box denotes the median (δ = 0.22/day), while the lines at the bottom and top of the box show the 25 and 75% quartiles, respectively. Whiskers outside the box show the 10 and 90% percentiles. The square indicates the estimated average (δ = 0.42/day).

