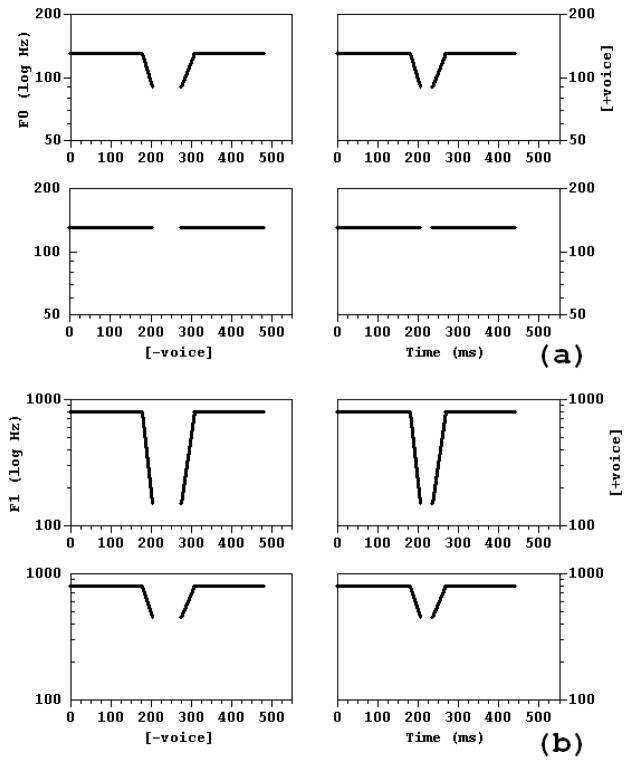
Figure 3.
2 × 2 stimulus arrays showing the trajectories of the synthesis parameters in the F1 and f0 × Closure Duration experiments (Experiments 1a,b). Arrangement of stimuli corresponds to that in Figure 2, in that positively correlated stimuli display the observed combinations of parameter values in [+voice] (upper right) and [−voice] (lower left) stops, and negatively correlated stimuli do not. The horizontal axis in each panel is time in ms, and the vertical axis is frequency in Hz (logarithmic scale). (a) F1 × Closure Duration: Left = Long Closure Duration of 70 ms, right = Short Closure Duration of 30 ms, top = Low F; offset-onset frequency of 150 Hz (650 Hz fall), bottom = High F1 offset-onset frequency of 450 Hz (350 Hz fall), (b) f0 × Closure duration: Left and right same as (a), top = Low f0 offset-onset frequency of 90 Hz (40 Hz fall), bottom = High f0 offset-onset frequency of 130 Hz (0 Hz fall).

