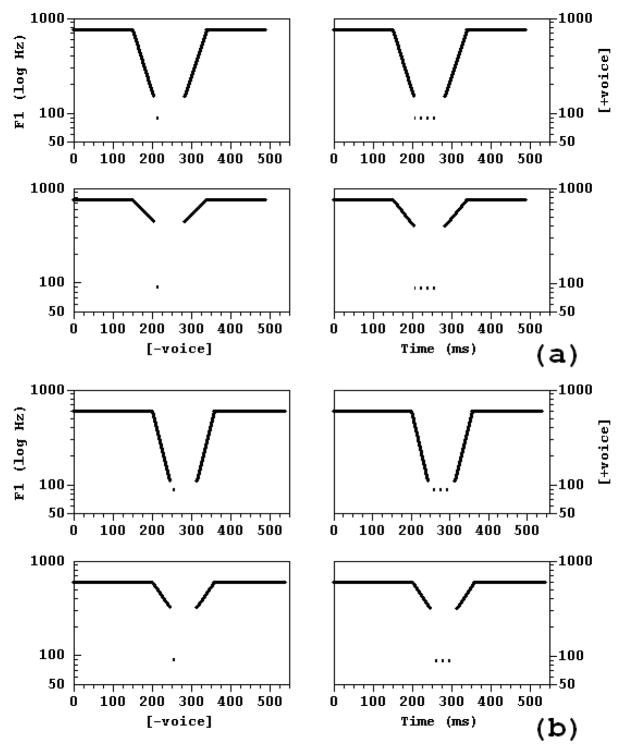
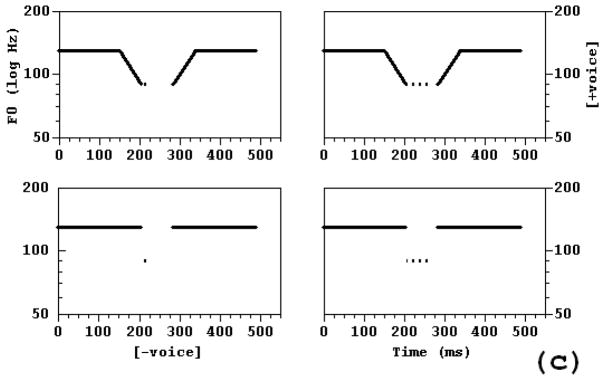
Figure 5.
2 × 2 stimulus arrays showing the trajectories of the synthesis parameters for the F1 and f0 × Voicing Continuation experiments (Experiments 2a,b). (a) Experiment 2a, F1 × Voicing Continuation, speech condition: The heavy lines represent the F1 trajectory, and the dashes the continuation of voicing into the stop closure. Left column = Short Voicing Continuation of 10 ms, right column = Long Voicing Continuation of 50 Ms, top row = Low F1 offset-onset frequency of 150 Hz (600 Hz fall from steady-state), bottom row = High F1 offset-onset frequency of 400 Hz (350 Hz fall), (b) Experiment 2a, F1 × Voicing Continuation, non-speech condition: Left and right same as (a), top = low F1 offset-onset frequency of 110 Hz (490 Hz fall), bottom = High F1 offset-onset frequency of 320 Hz (280 Hz fall), (c) Experiment 2b, f0 × Voicing Continuation, speech and non-speech conditions: Left and right same as (a), top = Low f0 offset-onset frequency of 90 Hz (40 Hz fall), bottom = High f0 offset-onset frequency of 130 Hz (0 Hz fall).


