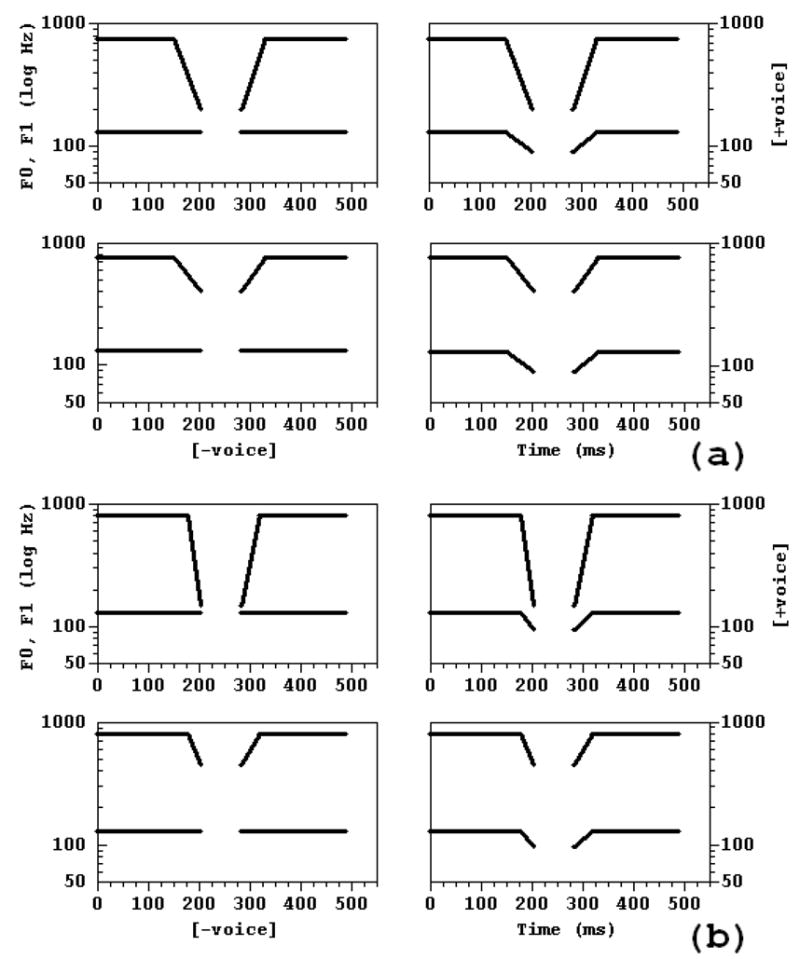
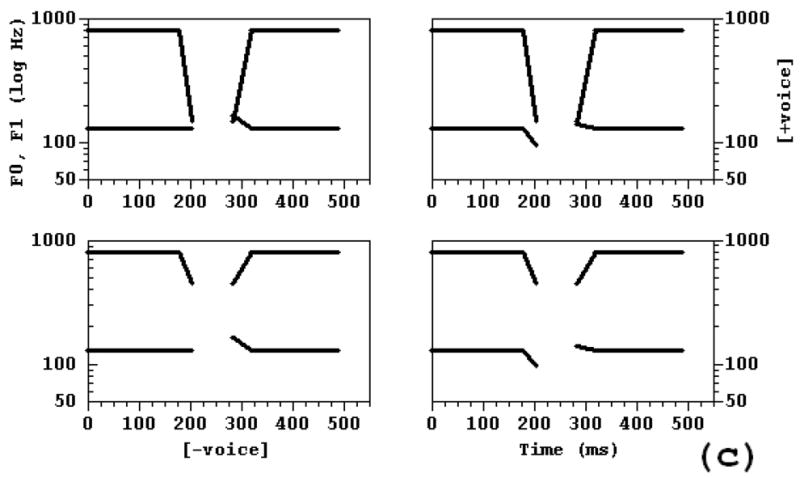
Figure 7.


2 × 2 stimulus arrays showing the trajectories of the synthesis parameters in the f0 × F1 experiments (Experiments 3a-c). Arrangement of stimuli corresponds to that in Figure 2, in that positively correlated stimuli display the observed combinations of parameter values, and negatively correlated stimuli do not. (a) First f0 × F1 experiment, speech and non-speech Conditions: Left = High F; offset-onset frequency of 130 Hz (0 Hz fall), right = Low f0 offset-onset frequency of 90 Hz (40 Hz fall), top = Low F1 offset-onset frequency of 200 Hz (550 Hz fall), bottom = High F1 offset-onset frequency of 400 Hz (350 Hz fall), (b) Second f0 × F1 experiment, Symmetric condition: Left = f0 offset-onset frequency of 130 Hz (0 Hz fall), right = f0 offset-onset frequency of 95 Hz (35 Hz) fall, top = Low F1 offset-onset frequency of 150 Hz (650 Hz Fall), bottom = High F1 offset-onset frequency of 450 Hz (350 Hz fall), (c) Asymmetric condition: Left = High f0 offset and onset frequencies of 130 and 165 Hz, respectively, right = Low f0 offset and onset frequencies of 95 and 140 Hz, respectively.
