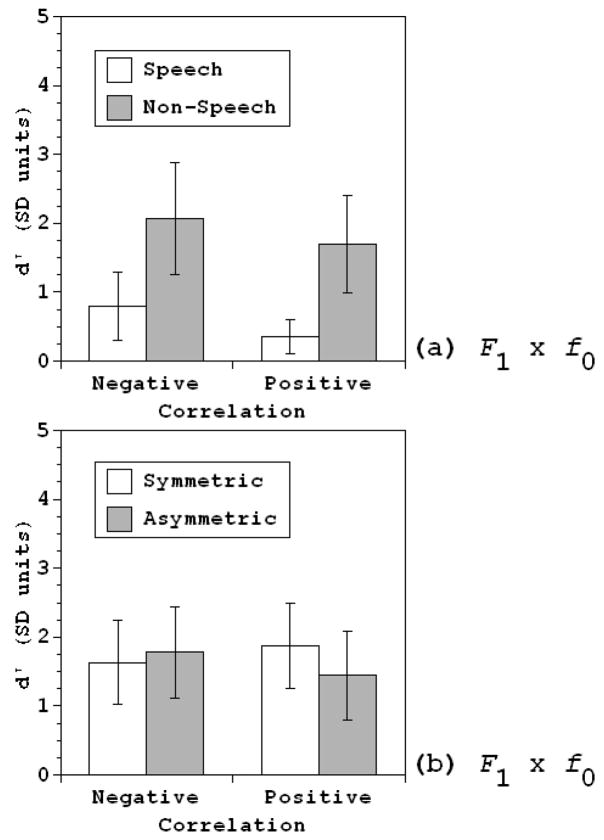
Figure 8.
Mean d′ values by classification across listeners, with 95% confidence intervals, for f0 × F1 experiments (a) Experiment 3a: White bars = speech condition, gray bars = non-speech condition. Negative = negatively correlated classification; Positive = positively correlated classification, (b) Experiments 3b,c: White bars = Symmetric condition, gray bars = Asymmetric condition. Otherwise, same as (a).

