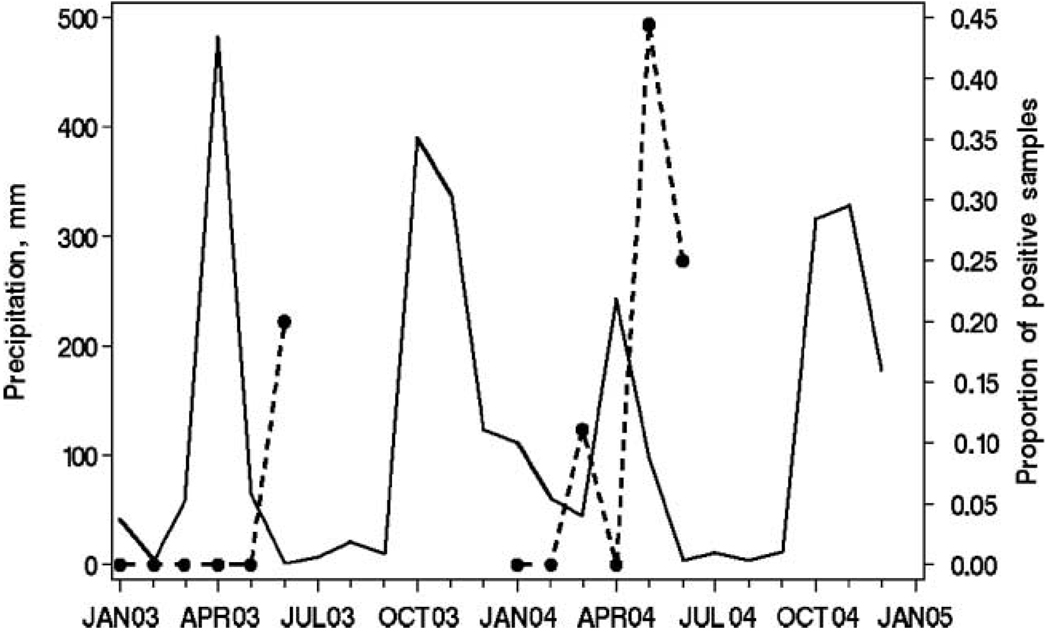
Figure 3.
Actual monthly precipitation in millimetres in Meru, Kenya by month of 2003 and 2004 and proportion of positive Meru Region surface water samples by month of 2003 and 2004. The solid black line represents precipitation in mm (left axis scale), and the dotted black line represents the proportion of positive surface water samples (right axis scale), by month (x axis, horizontal).

