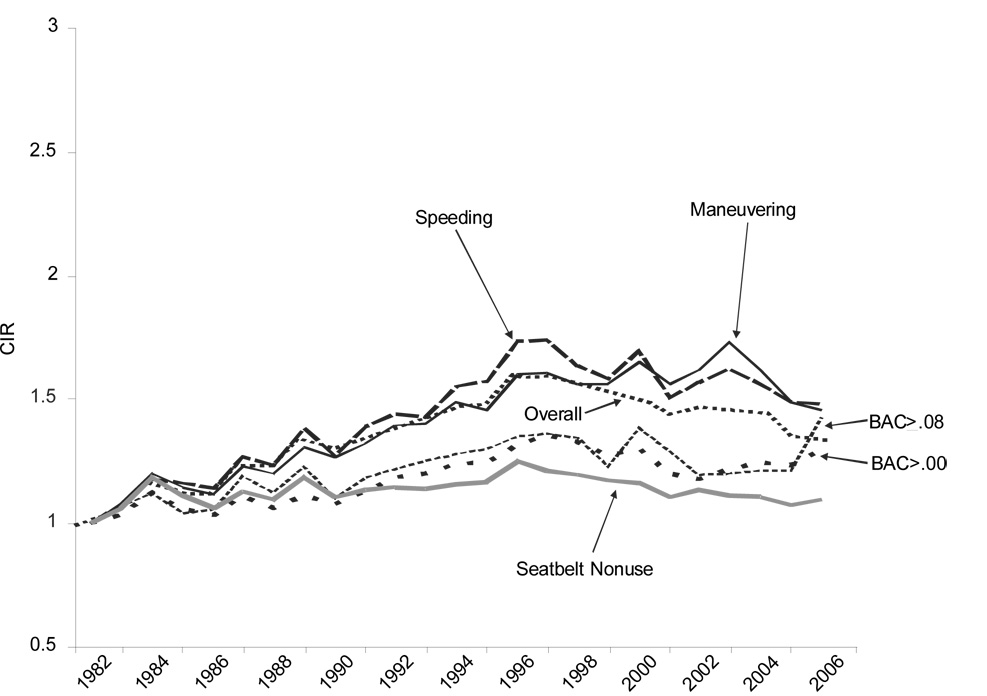
Figure 3.
Evolution of the annual CIR/RAIR statistic representing the odds of female drivers involvement in fatal single-vehicle crashes by type of crash, 1982–2006
Source: Computed from FARS datasets (downloaded from ftp://ftp.nhtsa.dot.gov/FARS/). “Overall” includes all drivers and all type of driving conditions. “BAC>.00” and “BAC ≥.08” denote drivers with positive BACs and BACs greater than or equal to .08, respectively. “Speeding,” “Maneuvering,” and “Seatbelt Nonuse” conditions are defined in the text and in Table 1.

