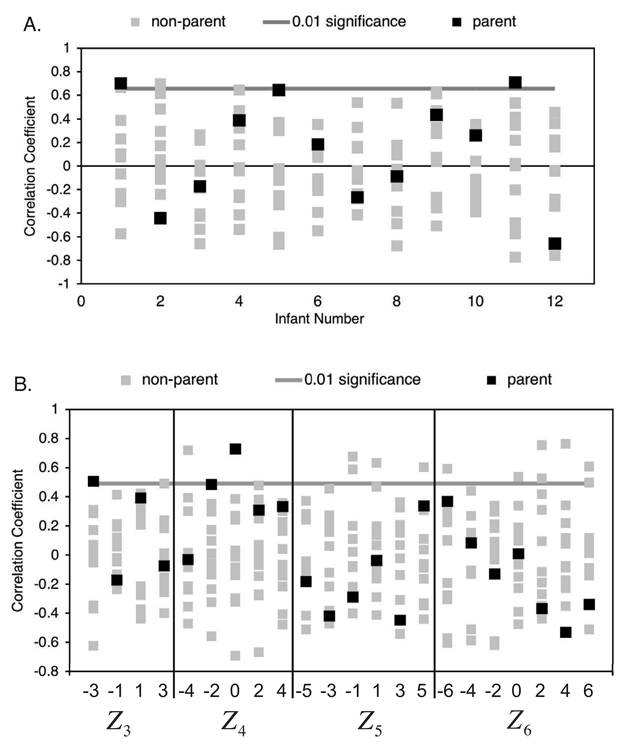
Figure 6.
A. Correlation between infant and adult 3rd-to-6th-order Zernike coefficient values. Black symbols represent the correlation between an infant and their parent across the set of coefficients. Gray symbols represent the correlation between the infant and the other adults. The line represents threshold for a significant positive correlation at the 0.01 level. B. Correlation between infant and adult distributions of each Zernike coefficient. Black symbols represent the correlation between infants aligned with their parents. Gray symbols represent the correlation between the infants and adults in a different alignment. The line represents threshold for a significant positive correlation at the 0.01 level.

