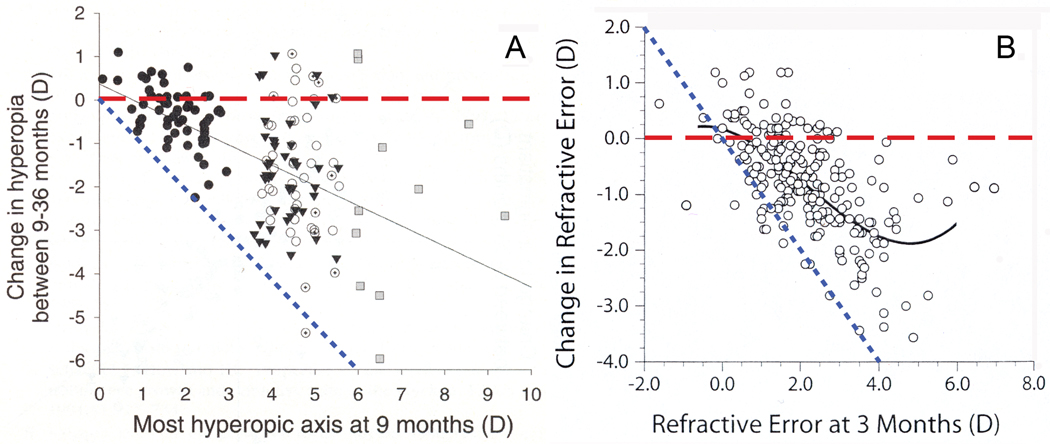
Figure 2.
Data from two studies of emmetropization during infancy. PANEL A presents the data of Atkinson, et al53. The filled triangles were hyperopes who did not wear glasses, the open circles were hyperopes who were compliant with glasses, the circles with crosses in them are the hyperopes who were not compliant with their glasses and the squares were high hyperopes excluded from the spectacle trial. The filled circles are the control group of low hyperopes. PANEL B presents the data of Mutti et al54, from uncorrected infants whose refractions were measured at three and nine months of age. The added horizontal dashed lines demonstrate the prediction for no change in refractive error over time, and the added dotted lines represent the prediction for full emmetropization for the initial refractive error. A color version of this figure is available online at www.optvissci.com.

