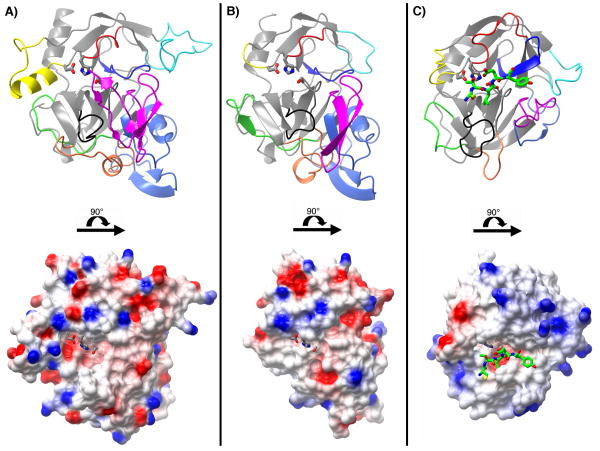
Figure 4.
A comparison of the N-terminal chymotrypsin-like domains of IgAP (A), and HbP (B) (PDB:1WXR (33)) and the structure of elastase (C) (PDB:1PPF (77)). The structural differences in IgAP are highlighted by differential coloring of the molecules according to the loop nomenclature utilized for the chymotrypsin family. The upper and lower figures in each panel are related to each other by a 90° rotation about the horizontal axis as indicated by the horizontal black bar. The structures in the lower portion of each panel are rendered as surfaces colored according to electrostatic potential. The residues of the catalytic triad in each enzyme are rendered as grey stick models. A portion of the bound inhibitor (C-T-L-E-Y; P3-P2′) in the elastase-turkey ovomucoid inhibitor complex is rendered as a green stick model colored by atom type to illustrate the subsite locations and active site cleft. In the upper portion of each panel the molecules are rendered as ribbon diagrams and colored according to the following color scheme: Loop A; dark blue 81-91 (34-41), Loop B; red 99-106 (56-64), Loop C; yellow 144-164 (97-103), Loop D; magenta 205-243 (143-149), Loop E; cyan 109-134 (74-80), Loop 1; orange 261-282 (185-188), Loop 2 black 311-319 (217-225) and Loop 3 green 246-257 (169-174). The N-terminal region, residues 26-78 (16-29) that forms a discrete domain in IgAP and HbP but is absent in elastase is colored light blue. The residue numbering given is that for IgAP with the corresponding numbering for elastase/chymotrypsin given in parentheses.

