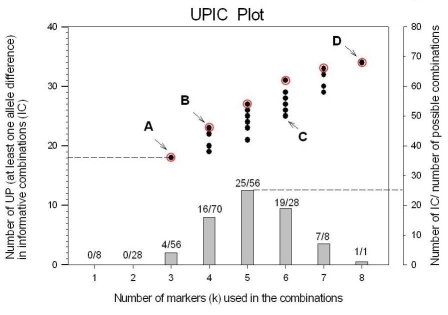
Figure 1.
Graphic representation of UPIC values for the 8 markers and 12 DNA samples in our example. •: unique patterns (UP)(y-axis,left) that allow discrimination of the 12 DNA samples tested, corresponding to informative combinations (IC) of variable number of polymorphic markers (x-axis). Ο: optimum UPIC values for different number of markers in the combination. A: minimum number of markers (3) in an IC that can discriminate the 12 DNA samples, the 3 markers can detect up to 18 unique patterns (UP) or alleles; B and C: point to IC of 4 and 6 markers (B, C) respectively, both providing similar amount of information in UP values; D: shows the maximum number of UP (34) detectable by all 8 markers. Numbers on top of the histogram are the actual number of IC for K number of markers used in the combinations, i.e., for combinations of 5 markers, there are 25 IC out of 70 possible combinations.

