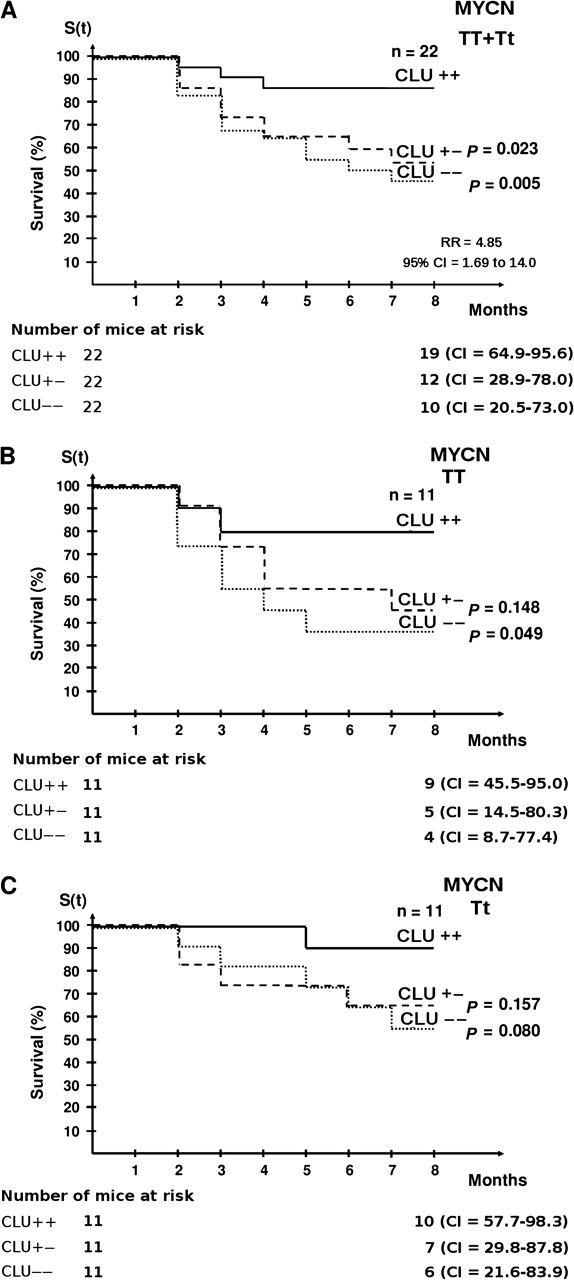
Figure 3.

Tumor-free survival in MYCN-transgenic mice with different dosages of clusterin alleles. Kaplan–Meier survival curves of mice with different MYCN-transgene dosages (homozygous = TT or heterozygous = Tt) and clusterin genotypes (homozygously deleted = − −; heterozygously deleted = + −; wild type = + +) are shown. A) Cumulative tumor-free survival of the entire population of homozygous (MYCN TT) plus heterozygous MYCN-transgenic mice (MYCN Tt) by clusterin expression. There were 22 mice in each MYCN-transgenic group. B) Tumor-free survival of homozygous MYCN-transgenic mice (MYCN TT) by clusterin expression. There were 11 mice in each MYCN-transgenic group. C) Tumor-free survival of hemizygous MYCN-transgenic mice (MYCN Tt) by clusterin expression. There were 11 mice in each MYCN-transgenic group. The log-rank test was used to assess whether the difference in cumulative tumor-free survival between groups was statistically significant (RR for neuroblastoma development in clusterin +/+ vs clusterin −/− for all MYCN-transgenic mice = 4.85, 95% CI = 1.69 to 14.00). The number of mice at risk at 0 and 8 months and the 95% CI for the survival at 8 months are also shown. All statistical tests were two-sided. CI = confidence interval; RR = relative risk.
