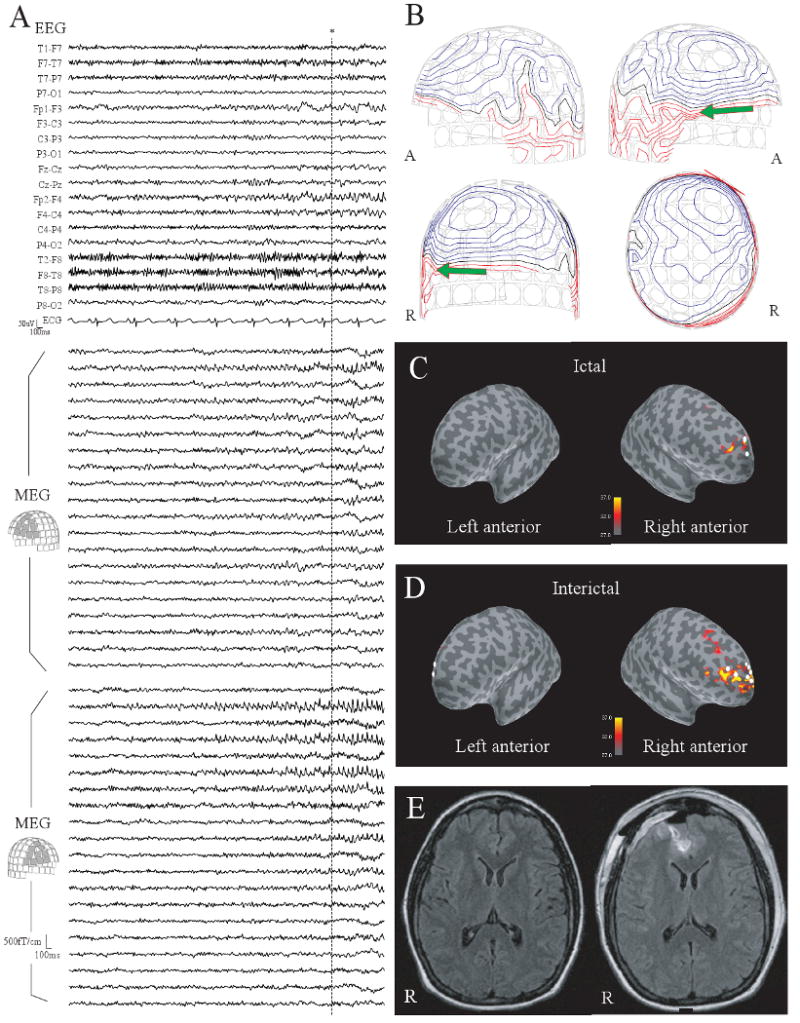
Fig. 2.

(A) The early part of ictal MEG and EEG in Patient 5. Small spike bursts are seen predominantly in the right frontal area. (B) Contour maps of magnetic fields at the peak of the MEG spike shown by * in (A). (C-upper) The dSPM map at the same peak. Activation in dSPM is seen in the right anterior frontal lobe. Three ECDs with GOF > 70% are obtained from 11 ictal spikes (white dots). (D) A dSPM map at the peak of a typical interictal spike. Activation is seen in a relatively a large part of the right frontal lobe. ECDs with GOF > 70% obtained from interictal spikes are distributed in the bilateral frontal lobes. Note that the dSPM maps shown here are obtained from a single spike and ECDs are calculated from each individual spike. (E-left) Presurgical FLAIR MRI. The abnormal signals in the right anterior frontal lobe suggest a cortical dysplasia. (E-right) Postsurgical FLAIR MRI. The lesion was removed by a surgical resection.
