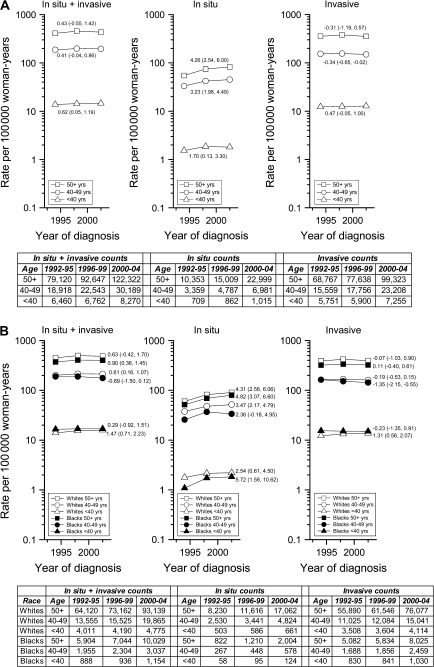
Figure 1.
Annual percentage changes (APCs) for age-adjusted incidence rate trends and absolute numbers in the National Cancer Institute's Surveillance, Epidemiology, End Results Program 13-Registry database (1992–2004) for all breast cancers combined (in situ + invasive), in situ cancers only, and invasive cancers only. A) APCs and absolute numbers by age (<40, 40–49, ≥50 years). B) APCs and absolute numbers by age (<40, 40–49, ≥50 years) and race (white, black). APCs are recorded with point estimates; 95% confidence intervals are in parentheses. Under the null hypothesis, non–statistically significant APCs indicate that the trend line for a given age group was no different than a horizontal or flat trend line with a slope of zero. Using Poisson regression models we also assessed whether trends varied by age group (A) or by race within age group, see text for details.

