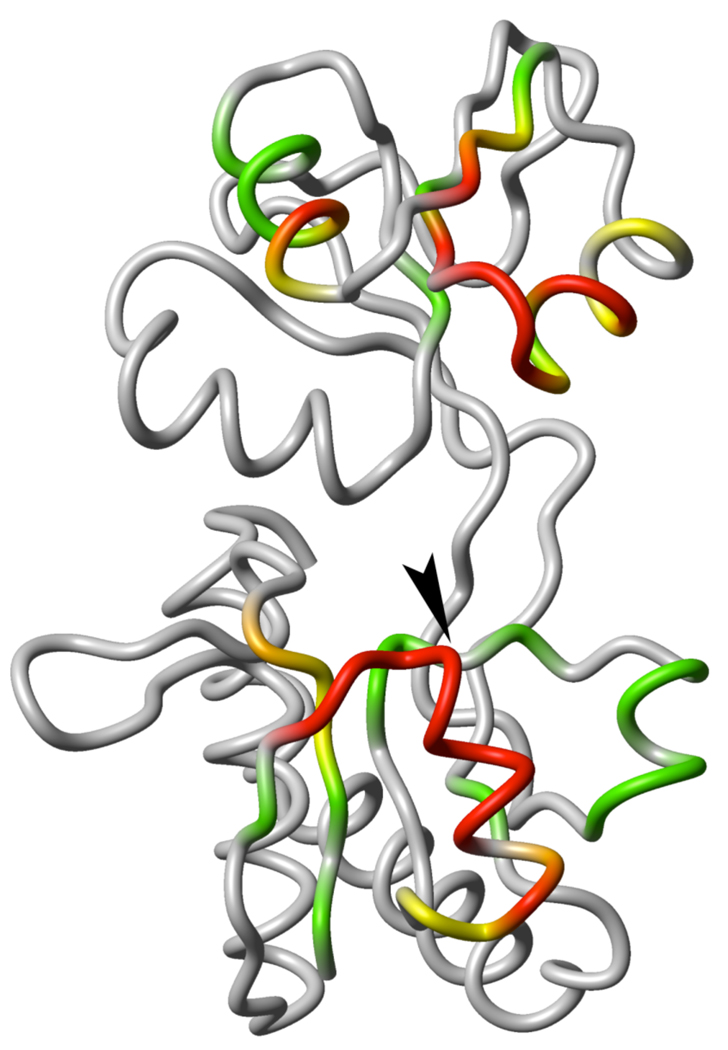
Figure 1.
Ligand-free, open conformation of GlnBP (PDB ID: 1GGG). The large domain is displayed at the bottom and the small domain on top. The color scheme indicates HN-PRE values observed on the bound GlnBP S51C sample: red, PRE > 40 s−1 or completely broadened peak; orange, 40 ≥ PRE > 30 s– 1; yellow, 30 ≥ PRE > 20 s−1; green, 20 ≥ PRE > 10 s−1; grey, PRE ≤ 10 s−1 or missing due to overlapped/unassigned peak. An arrowhead indicates the position of the S51C point mutation. All molecular graphics were generated with MOLMOL.9

