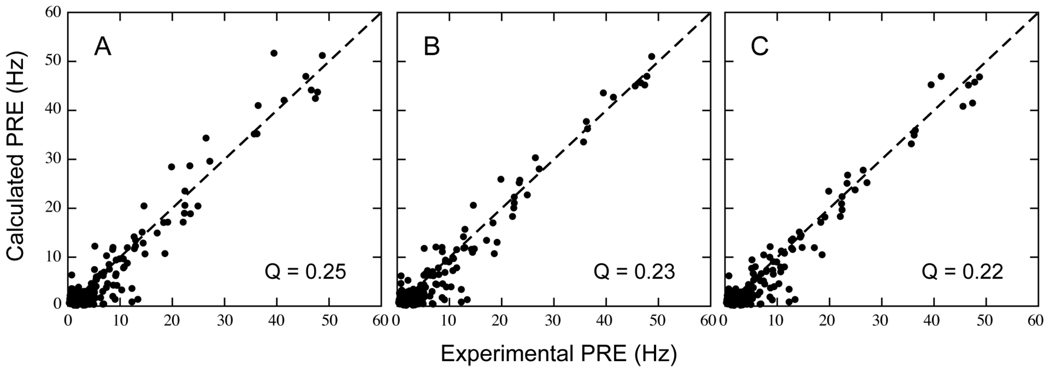
Figure 4.
Correlation between experimental and calculated 1HN-PRE values for structures computed via optimization of the protein backbone with simultaneous (A and B) or previous (C) optimization of the paramagnetic probe conformer(s). Plot A stems from a single-conformer probe representation, while plots B and C result from a three-conformer ensemble. The average overall Q-factor is indicated. See Table 1 for details.

