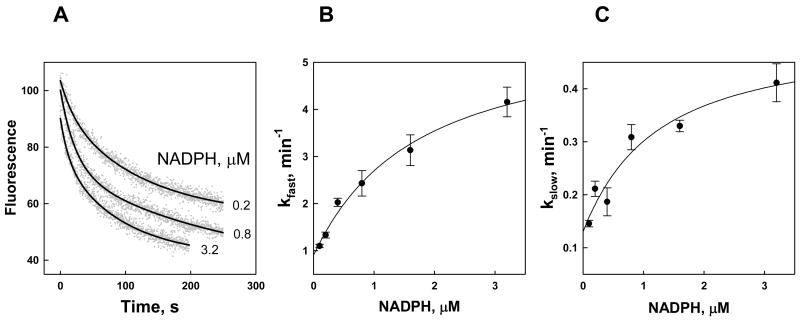
Fig. 2. Kinetics of NADPH binding to Kvβ2.
A. Time-dependent changes in Kvβ2 fluorescence quenching upon addition of NADPH. NADPH at the indicated concentrations was added at room temperature to the nucleotide-free Kvβ2 (0.21 μM) in a stirred quartz fluorimeter cuvette and the decrease in protein fluorescence (ex. 290 nm; em. 335 nm) was monitored for 250 s. Dots represent experimental points and lines are the best fits of a two-exponential equation (eq. 2) to the data. B, C. The fast (B) and slow (C) exponential constants are plotted against NADPH concentration. Data are shown as mean ± standard error determined with at least 3 replicates. The lines are the best fits of eqs. 3–4 to the data.

