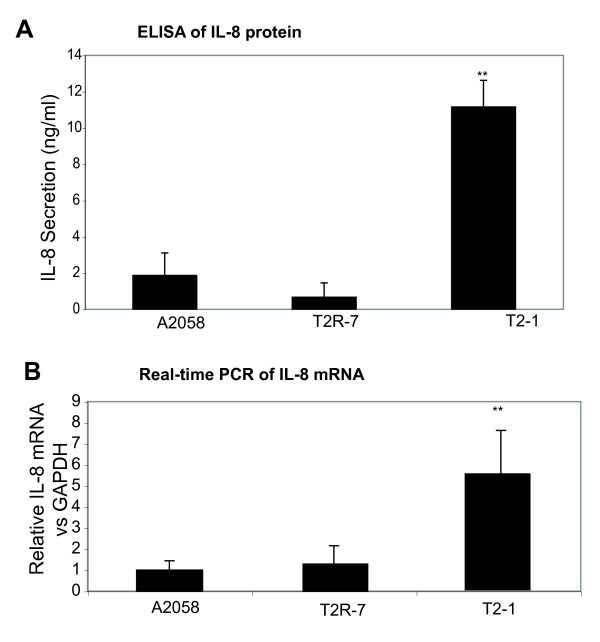
Figure 1.
IL-8 protein and mRNA expression in cell lines A2058, A2058T2-1, and A2058T2R-7. (A) IL-8 secretion in cell lines A2058, A2058T2-1, and A2058T2R-7. Equal number of cells was plated in 6-well plates. After growing for 24 hours, the supernatant was collected and assayed for IL-8 ELISA. Data are the mean ± SD of a single experiment assayed in triplicate and is representative of 3 separate experiments. **P < .001 for A2058 vs A2058T2-1. (B) IL-8 mRNA expressionin the A2058, A2058T2-1, and A2058T2R-7 cells. Total RNA was extracted using TRIzol reagent and the RNA integrity was verified by electrophoresis gel. All IL-8 expression levels were normalized to the GAPDH levels of the same sample. Percent expression was calculated as the ratio of the normalized value of each sample to that of the corresponding untreated control cells. All real-time PCR reactions were performed in triplicate. **P < .001 for A2058 vs A2058T2-1.

