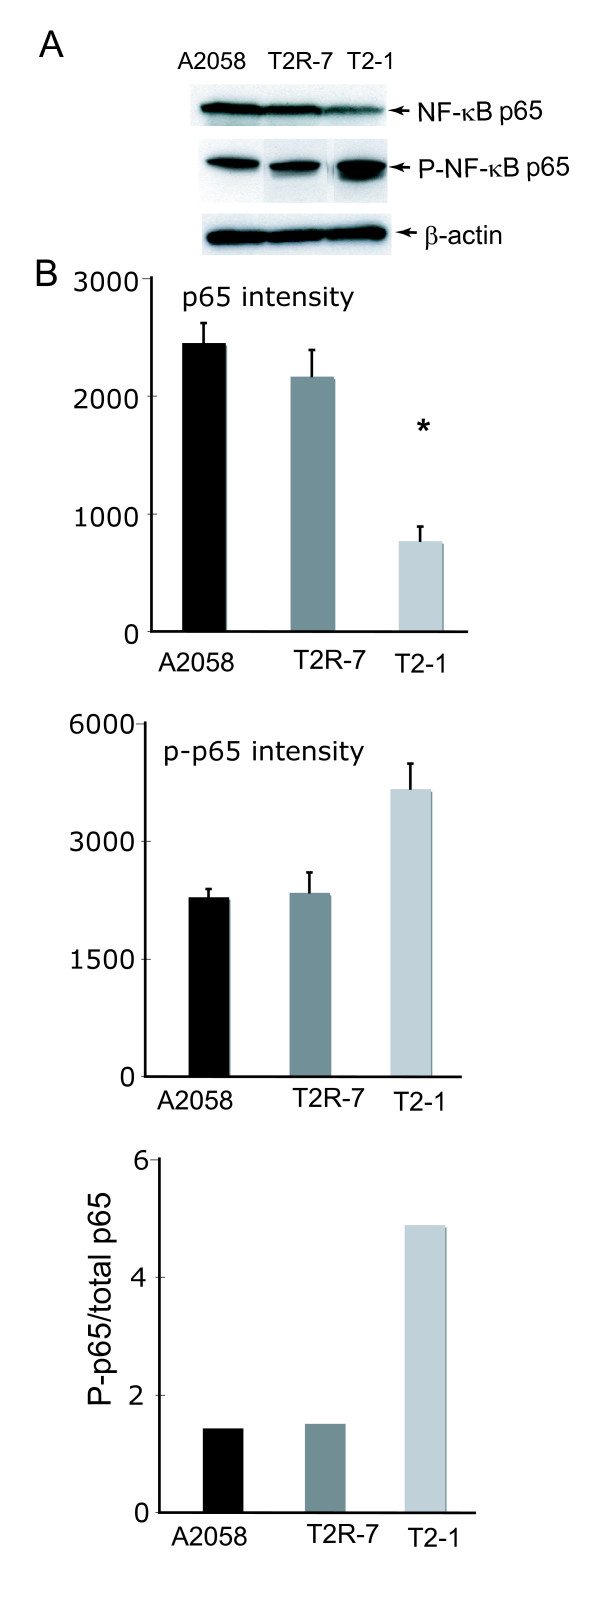
Figure 3.
Immunoblot of whole cell NF-κBp65 and phospho- p65 in cell lines A2058, A2058T2-1, and A2058T2R-7. (A) Western blot of p65 and phospho-p65; (B) Densitometry of p65 and phospho-p65. Relative band intensity was determined using NIH Image 1.63 software. Data are reported as mean ± SD of 3 independent experiments.

