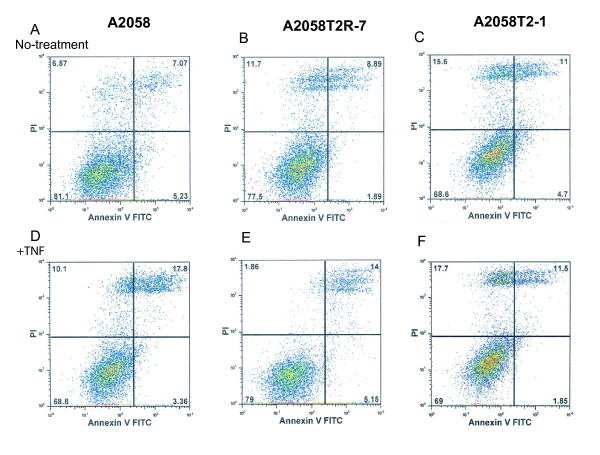
Figure 5.
Apoptosis in A2058, A2058T2-1, and A2058T2R-7 with or without TNF-α treatment. After 6 h of treatment with TNF, 1 × 10⁶ adherent cells were trypsinized and incubated with FITC-conjugated annexin V and propidium iodide (PI) for 15 min in the dark. Cells were analyzed by flow cytometry. The percentages of cells in each groups within the gated areas are indicated. In the gate areas, the up-right panel is for the population of later apoptotic cells and the low-right panel is for the early apoptosis cells. Dot plots of early apoptotic cells have increased Annexin VFITC fluorescence only, whereas necrotic and late apoptotic cells have increased annexin V and PI fluorescence. Axes are labelled with arbitrary fluorescence units. Data are from a representative of three independent experiments that gave similar results.

