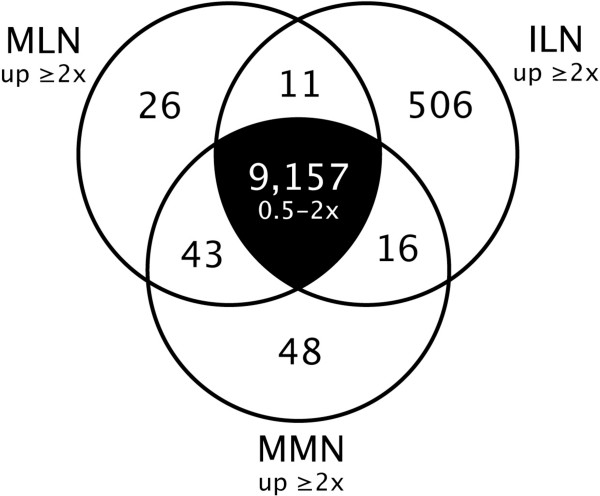
Figure 3.
Comparison of gene expression in different nectary types. The number of genes displaying a two-fold or greater difference in expression in different nectary types is indicated (e.g., two-fold higher in MLN over ILN and MMN; equal variance two-tailed t-test, p < 0.05; FDR q < 0.05). Genes having similar expression levels in all nectaries types were also determined (0.5 – two-fold difference, center portion of the diagram). An additional 2,661 genes displayed fold changes greater than two between nectary tissues; however, these changes were not statistically significant (p or q > 0.05). Full results are available in Additional file 8, and lists of genes displaying five-fold or greater changes between MLN versus ILN and MMN versus MLN are shown in Additional files 9 & 10, respectively.

