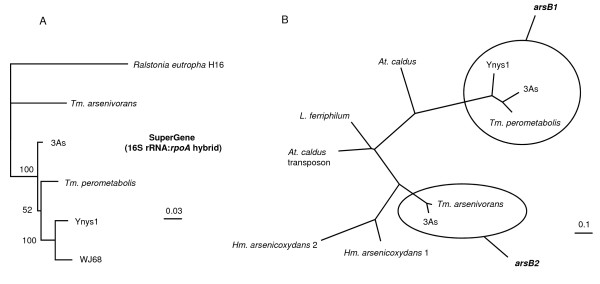
Figure 1.
Phylogenetic dendrogram of the SuperGene construct of both the 16S rRNA and rpoA genes (A) of the Thiomonas strains used in this study. Ralstonia eutropha H16 served as the outgroup. Numbers at the branches indicate percentage bootstrap support from 500 re-samplings for ML analysis. NJ analyses (not shown) produced the same branch positions in each case. The scale bar represents changes per nucleotide. (B) Phylogenetic dendrogram of the arsB genes of the Thiomonas strains used in this study and some other closely-related bacteria. Both ML and NJ (not shown) analysis gave the same tree structure. The scale bar represents changes per nucleotide. Sequences obtained using the arsB1- and arsB2-specific internal primers were not included in the analysis as the sequences produced were of only between 200 – 350 nt in length.

