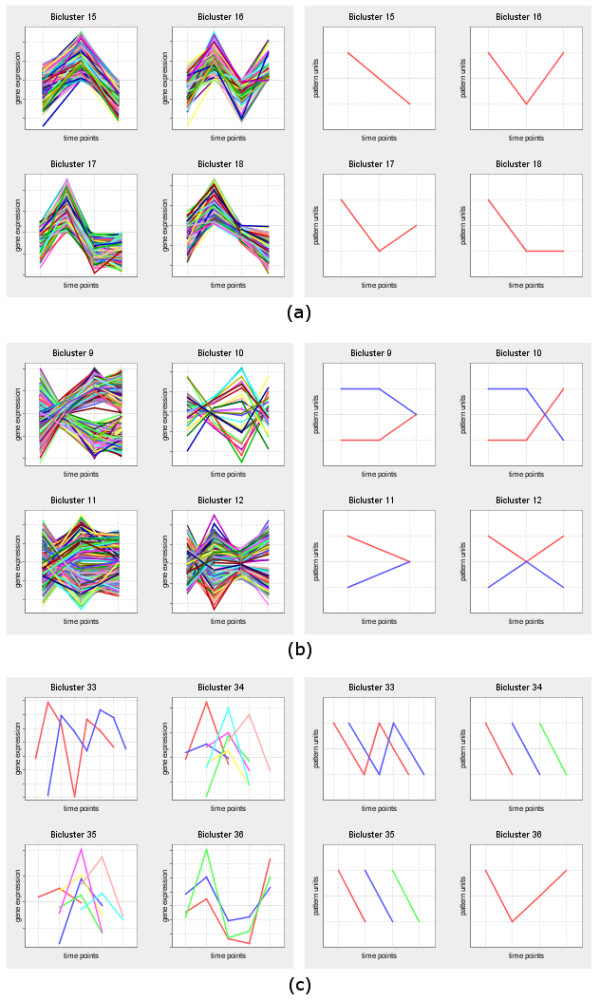
Figure 4.

Expression and pattern charts. This figure shows examples of expression and pattern charts of (a) CCC-Biclusters, (b) CCC-Biclusters with anti-correlated patterns, and (c) CCC-Biclusters with time-lagged patterns. In expression charts, expression values can be normalized on the fly by checking the "Normalize to mean 0 and std 1" checkbox.
