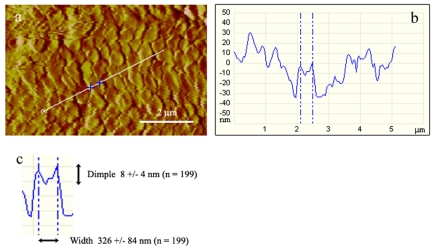
Fig. 6.
(a–c) Height profiling of toe pad epithelium. (a) Deflection image showing the line from which the height profile (b) was taken. The two crosses delineate a columnar nanopillar that lay precisely on the profile line, showing that these peg-like structures have a small dimple at their centres. (c) Average values (means ± s.d.) of the width of the nanopillars and the depth of the dimples based on 199 measurements from height profiles such as that shown in b.

