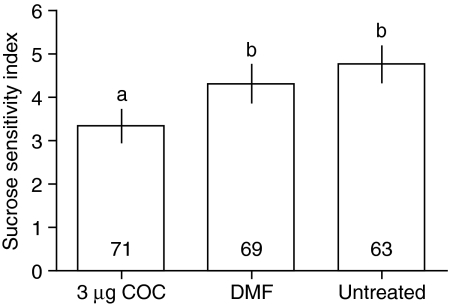
Fig. 4.
Effect of cocaine (COC) on sucrose responsiveness. 20 μl drops of seven different sucrose solutions ranging in concentration from 0.1% sucrose to 60% sucrose were presented to the antennae of harnessed bees in the laboratory. The first sugar solution (1–7) eliciting proboscis extension was the sucrose sensitivity index; therefore a lower value indicates higher sucrose sensitivity. Bars show means and 95% confidence intervals. Differences between treatment groups were tested with Kruskal-Wallis tests (median sucrose sensitivity index: 3 μg cocaine, 3; DMF, 4; untreated, 5. Kruskal-Wallis statistic 24.17, d.f.=2, P<0.001) and comparisons between specific groups were performed using Dunn's post hoc tests. Bars that do not differ significantly (Dunns post hoc test, P>0.05) are marked by the same letter above the bar. Sample size shown in bars.

