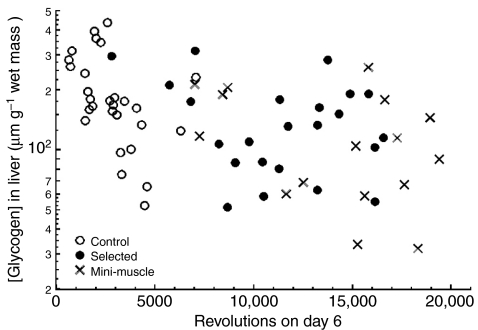
Fig. 2.
Liver glycogen concentration showed a significant (P=0.0040) negative relation with amount of wheel revolutions in the 02:00 h group (Group 2, as outlined in Table 1; see Table 2 for statistical analysis), but no differences among control (C), `high runner' (HR) normal (`selected') or HR mini-muscle mice.

