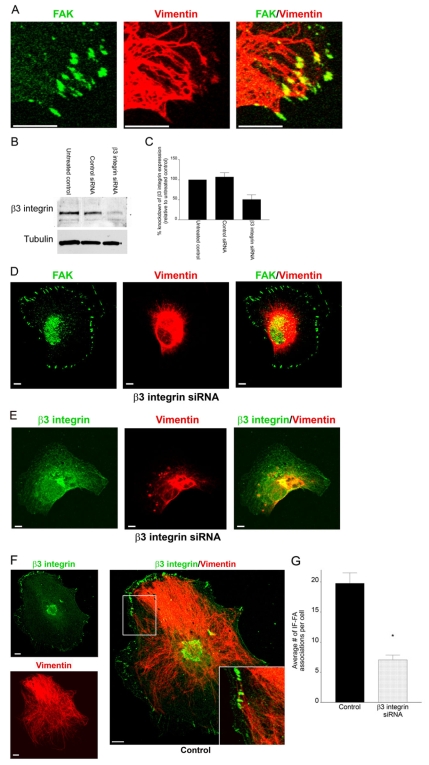
Fig. 1.
Knockdown of β3 integrin in TrHBMECs perturbs interactions between IFs and the cell surface. (A) TrHBMECs were stained for FAK (green) and vimentin (red) as indicated. The panel on the right shows an overlay of the green and red channels. The samples were viewed by confocal microscopy with the focal plane being proximal to the substratum-attached surface of the cells. (B) Extracts of mock-transfected TrHBMECs (untreated control) and TrHBMECs transfected with either control siRNA or β3 integrin siRNA were probed first with a β3 integrin antibody and then reprobed with tubulin. (C) Analysis of densitometric scans of western blots from three different experiments equivalent to those in B. Error bars represent s.e.m. of three experiments. (D) TrHBMECs transfected with β3 integrin siRNA were stained for FAK (green) and vimentin (red) as indicated. (E) TrHBMECs transfected with β3 integrin siRNA were stained for β3 integrin (overexposed to show green) and vimentin (red) as indicated. (F) TrHBMECs transfected with control siRNA were stained for β3 integrin (green) and vimentin (red) as indicated. The inset in the panel on the right is a higher magnification of the boxed area. (G) Quantification of the IF-FA association in TrHBMECs transfected with β3 integrin siRNA compared with the control (*P<0.01). Error bars represent s.e.m. of three experiments, counting a total of 200 cells. Scale bars: 10 μm.

