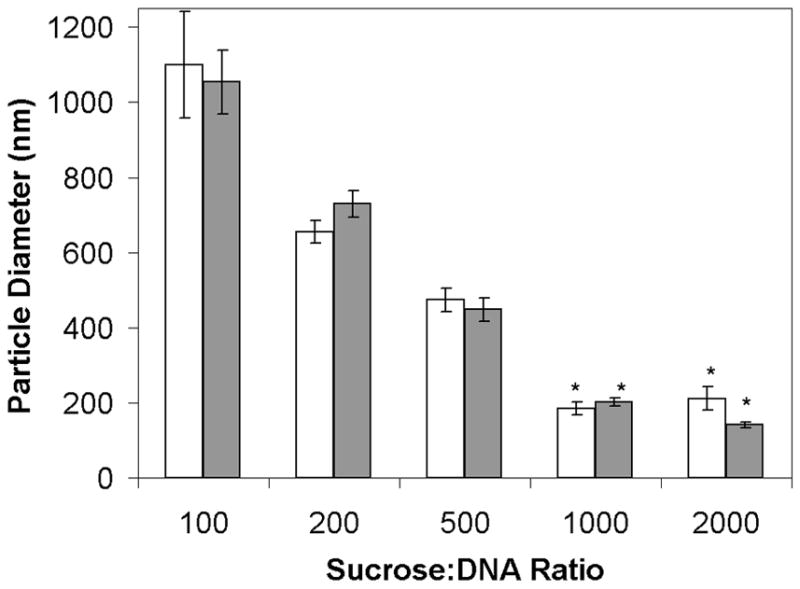
Figure 2.

Lipoplex size after 1 hour or 24 hours freezing. White and gray bars indicate samples frozen at −30 °C for 1 hour and 24 hours, respectively. All samples have 1 μg/ml initial DNA concentration. Each bar represents the mean ± one standard error of triplicate samples. Asterisks indicate particle sizes that were not significantly different from fresh samples. There is no significant difference between the bars at each sucrose/DNA ratio.
