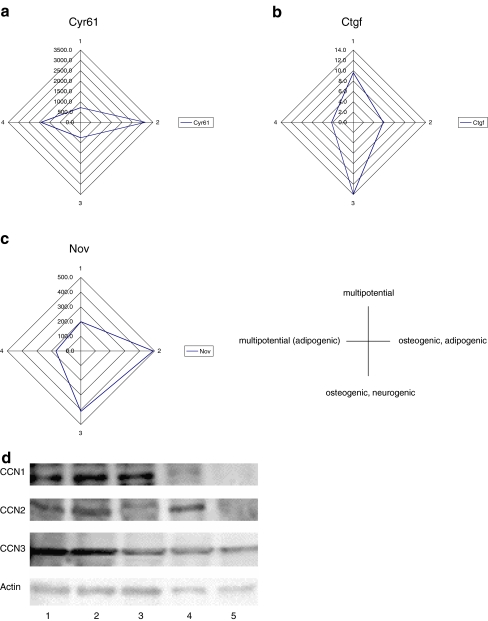
Fig. 4.
Expression profile of CCN1 (a), CCN2 (b), and CCN3 (c) mRNAs in four different mouse bone marrow derived mesenchymal stem cell lines. Top (1): 9-15c, right (2): Kusa-O bottom (3): Kusa-A1, left (4): H-123. Normalization of relative expression level was done by the comparison with a set of house keeping genes in the genechip of Affymetrix. All quantitative analyses were done by Affymetrix Gene Spring with normalization with several house-keeping genes. (d) Western blot analysis with anti-CCN1, CCN2 and CCN3. 1: Kusa-A1, 2: Kusa-O, 3: 9-15C, 4: H-123, 5; MC3T3-E1

