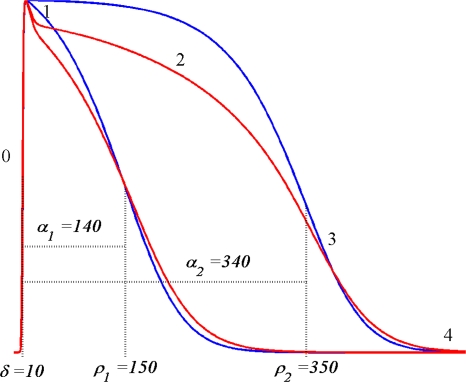
Figure 11.
Examples of TMP wave forms based on (14), red lines (c = 0.08, τp = 8, and βp = 0.35), and (5) blue lines with no spike/plateau. The constants δ and ρ specify two different timings of activation and recovery; the corresponding activation recovery intervals are α = ρ − δ. The numbers (0–4) indicate the phase of the action potential

