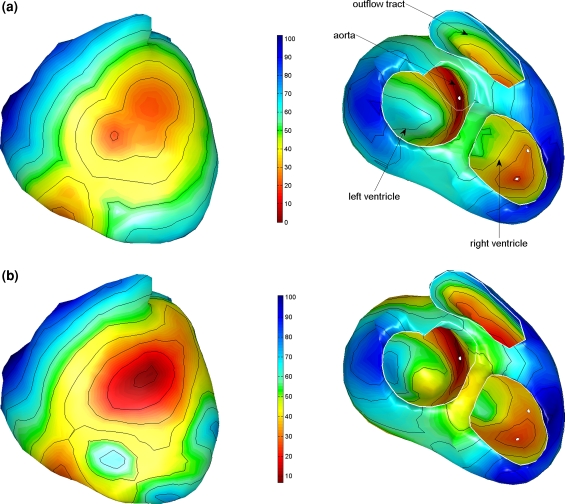
Figure 2.
Estimated activation sequences of the ventricles of a healthy subject. (a) The initial estimate resulting from the multi-focal search algorithm; the white dots indicate some of the foci that were identified. (b) The result of the subsequently applied non-linear optimization procedure. Isochrones are drawn at 10 ms intervals. The ventricles are shown in a frontal view (left) and basal view (right)

