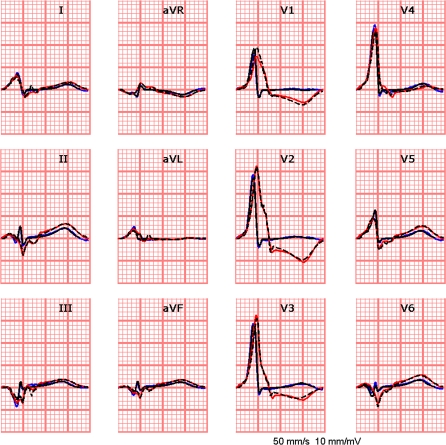
Figure 8.
The simulated (black lines) and measured (blue lines) ECGs for a fusion beat (blue lines), i.e., activation initiated by both a Kent bundle and the His-Purkinje system, and the simulated (black lines) and measured (red lines) ECGs of a beat for which the AV node was blocked by adenosine, leaving only the Kent bundle intact

