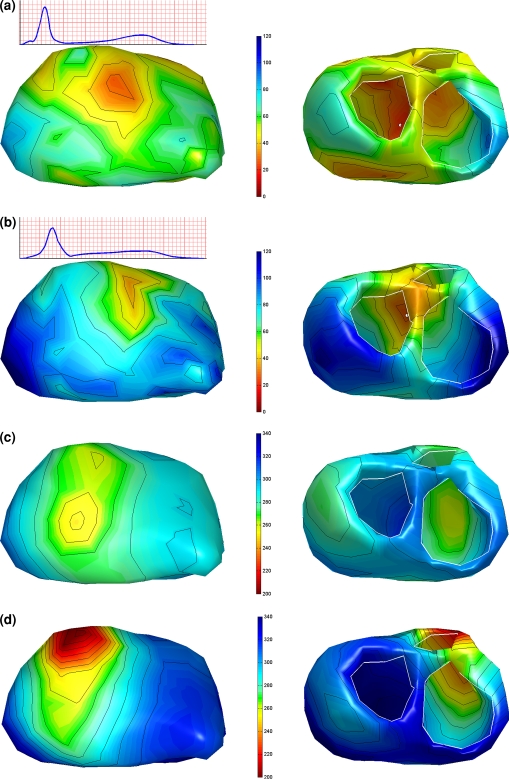
Figure 9.
Activation (a, b) and recovery (c, d) of two beats in a Brugada patient during an Ajmaline provocation test. Panels (a) and (c) show the activation respectively the recovery sequence estimated from the baseline ECG. Panels (b) and (d) show the activation respectively the recovery sequence just after the last infusion of the Ajmaline. Color scale is the same for Panels a & b and Panels c & d. Remaining legend as in Fig. 2

