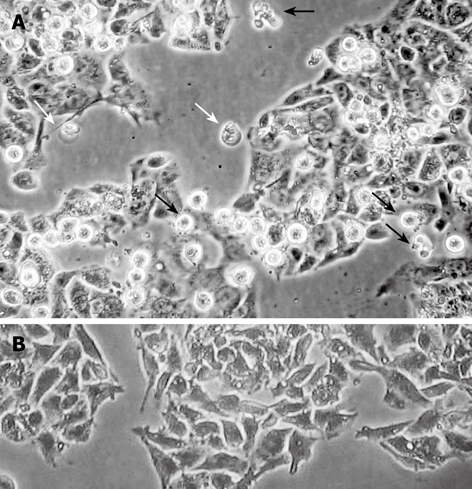
Figure 2.

Morphological changes in HepG2 cells after 48 h treatment with 12 μmol/L chelidonine (LD50) visualized by phase contrast microscopy. A: Apoptotic cells (black arrows) and a few cells undergoing blister cell death (white arrows) are clearly seen; B: Untreated control HepG2 cells.
