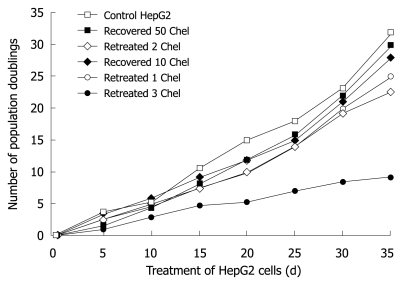
Figure 6.
Number of population doublings after long-term treatment with a sub-apoptotic dose of chelidonine (0.1 μmol/L) or recovered cells after 48 h exposure to LD50 concentration of chelidonine in comparison with control HepG2 cells. In re-treatment experiments (long-term treatment) HepG2 cells were exposed to 0.1 μmol/L only 48 h in each passage and followed by recovery with normal medium devoid of chelidonine. Each point indicates the mean value of a duplicated experiment.

