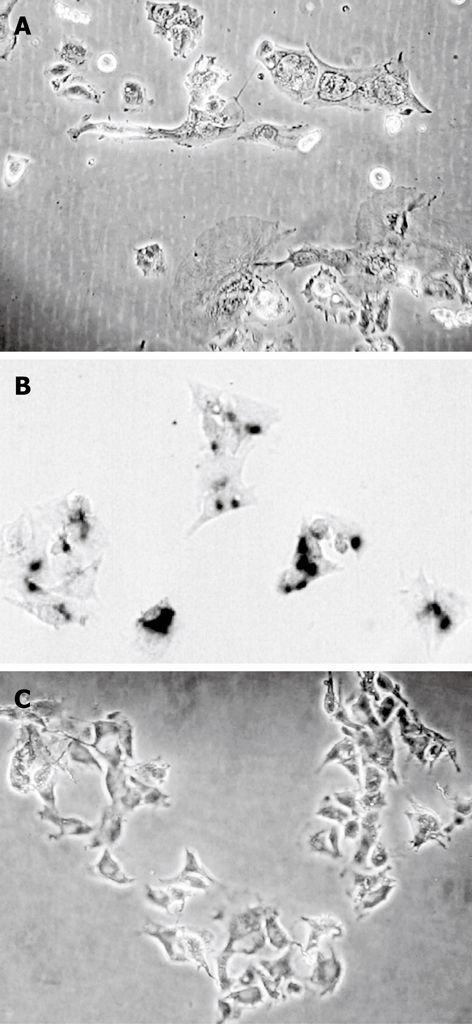
Figure 7.

The morphological changes and induction of senescence in HepG2 cells in a long-term treatment experiment. A: HepG2 cells after treatment five times with 0.1 μmol/L chelidonine; B: Cells retreated five times stained for β-galactosidase activity; C: Stained control cells.
