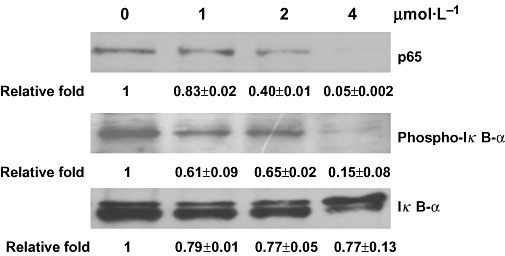
Figure 3.

Signal transduction pathways contributing to the inhibition of nuclear factor-κB activity by quinoclamine in HepG2 cells. HepG2 cells were treated with 0, 1, 2 and 4 µmol·L−1 of quinoclamine. The phosphorylated IκB-α and non-phosphorylated IκB-α in cellular extracts were detected by Western blot. The p65 protein in nucleus was also determined by Western blot. Relative fold, which is presented as the comparison of the band intensity relative to untreated cells, is shown on the bottom. Values are mean ± standard error of two independent assays.
