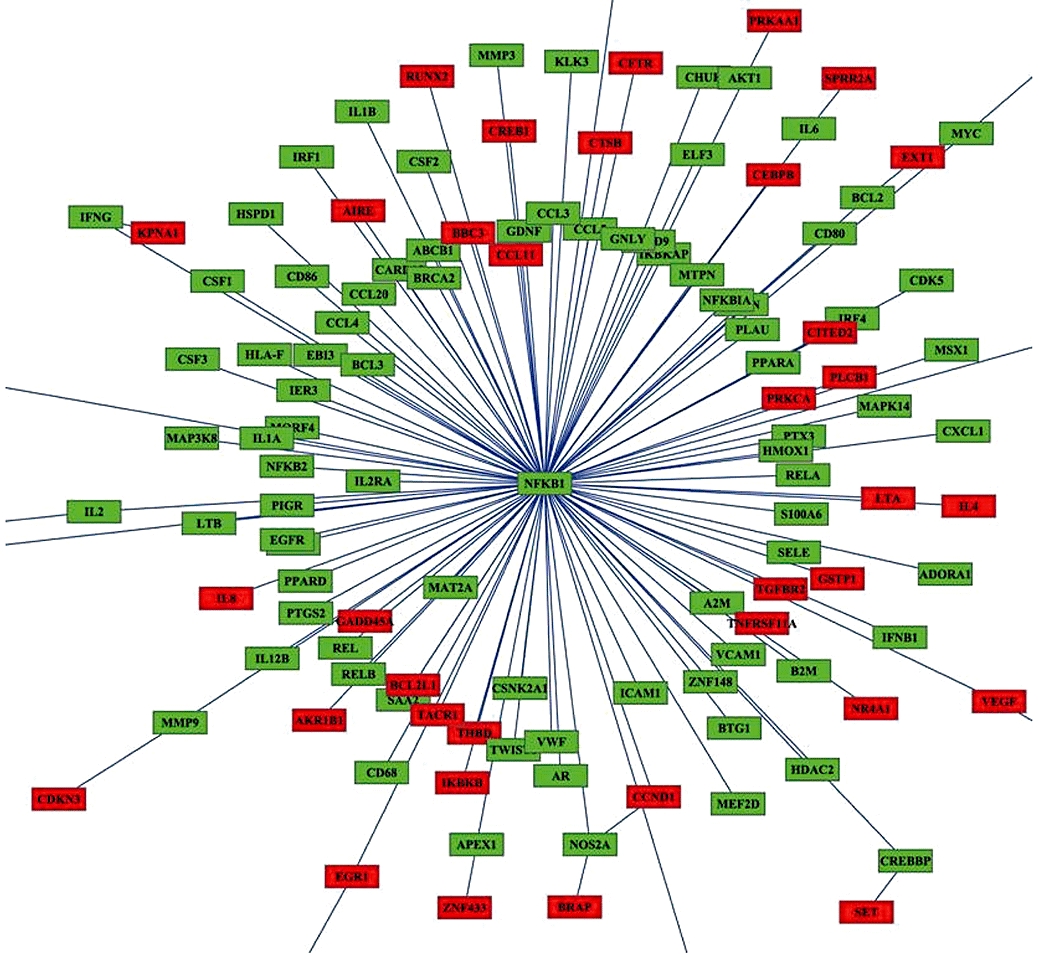
Figure 4.

Network analysis of quinoclamine-regulated genes in HepG2 cells. The relationship between nuclear factor-κB (NF-κB) target genes and differentially expressed genes responsive to 4 µmol·L−1 quinoclamine was analysed by BiblioSphere Pathway Edition software. The connection between NF-κB and quinoclamine-regulated genes was visualized by cytoscape software. Nodes for over-expressed genes and NFKB1 are colour-coded according to their log2 expression values.
