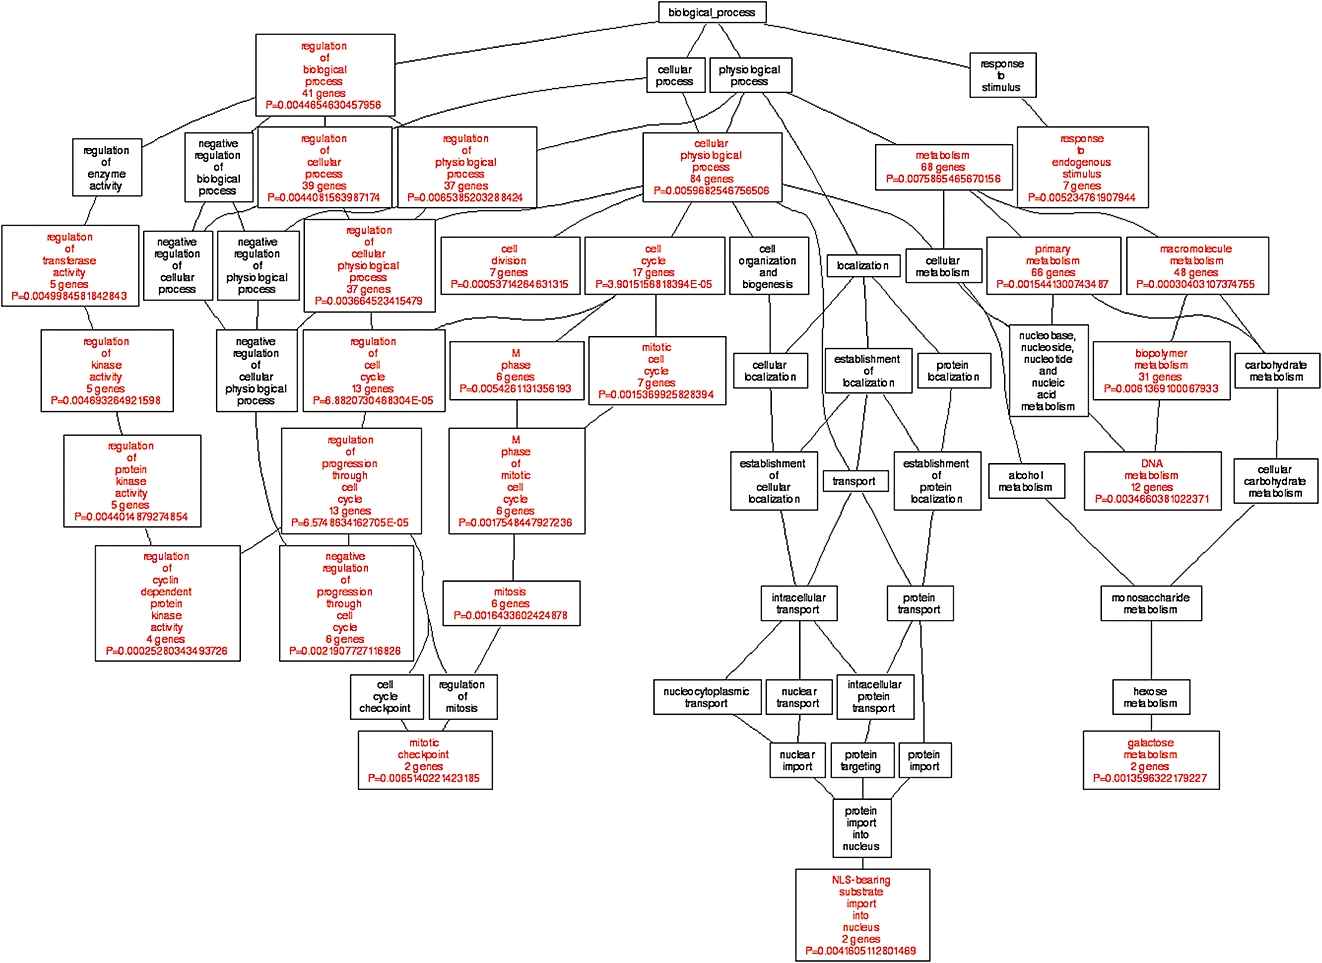
Figure 5.

Gene ontology (GO) analysis of quinoclamine-regulated genes in HepG2 cells. Differentially expressed genes responsive to 4 µmol·L−1 quinoclamine in single and dual channel hybridization experiments were organized by using Gene Ontology Tree Machine. The tree indicates the GO structure. The enriched GO categories (P < 0.01 and at least two genes) are coloured red, and non-enriched ones are coloured black.
