Figure 5.

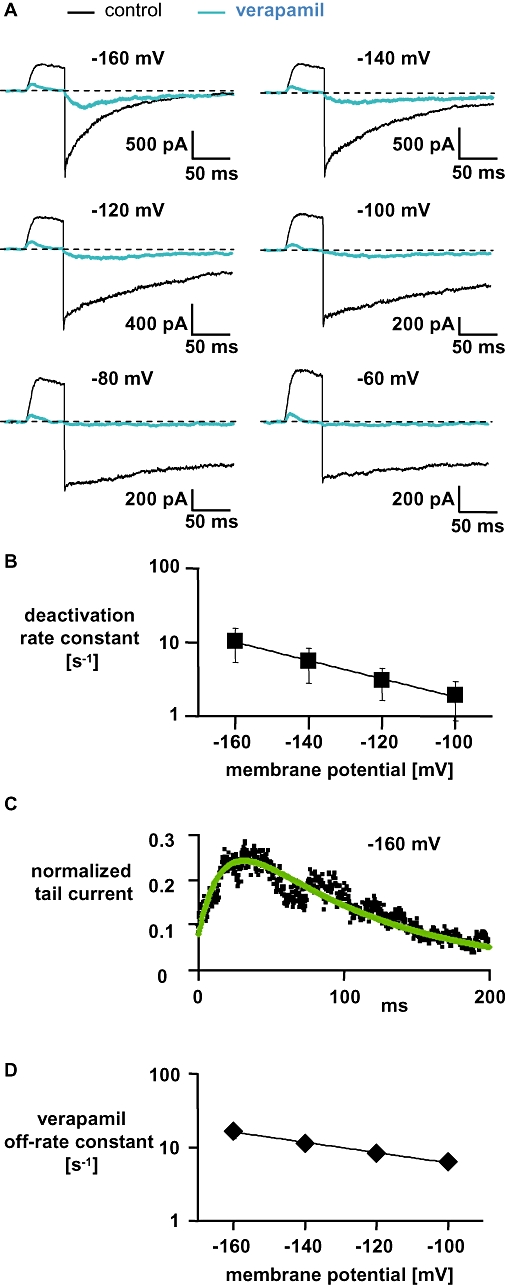
Characteristics of verapamil-induced block of currents through wild-type hKv1.3 in high [Rb+]o and high [K+]i. (A) Currents were elicited in the outside-out configuration as described in the legend to Figure 4A. (B) Deactivation rate constants (mean ± SD, n= 4) were obtained as described in the legend to Figure 4B and plotted against the applied membrane potential. The straight line represents a mono-exponential fit to the data with a slope of −0.0286 mV−1 indicating a voltage dependence of deactivation in [Rb+]o of e-fold/−35 mV. (C) Normalized tail currents at −160 mV (data from A; black squares) and the simulation of the current (green line) were obtained as described in the legend to Figure 4C. (D) Off-rate constants (mean ± SD, n= 3) for verapamil were obtained by the simulation and plotted against the applied membrane potential. The straight line represents a mono-exponential fit to the data with a slope of −0.012 indicating a voltage dependence of the verapamil off-rate in [Rb+]o of e-fold/−83 mV. Error bars are shown when they exceed the size of the symbols.
