
Figure 4.
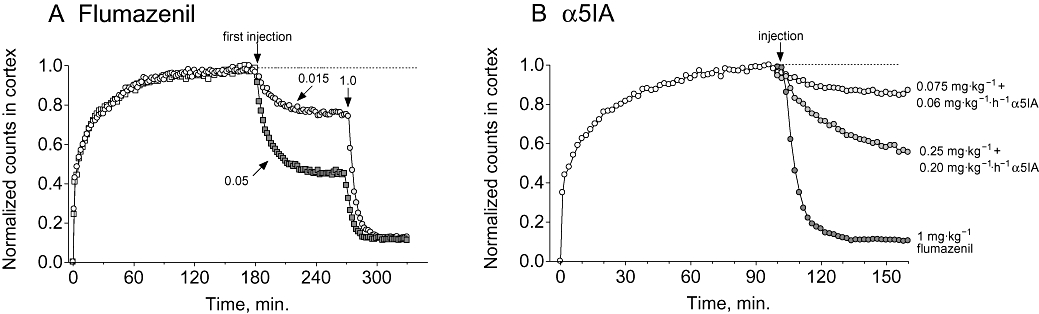
Representative time–activity curves showing the displacement of [123I]iomazenil (∼0.4 mCi bolus followed by 0.05–0.06 mCi·h−1 infusion) from rhesus monkey brain using either flumazenil or α5IA. (A) [123I]iomazenil was displaced by bolus injections of either 0.015, 0.05 or 1.0 mg·kg−1 flumazenil (arrows indicate time of bolus injections). (B) [123I]iomazenil was displaced by α5IA administered as a bolus followed by infusion (0.075 mg·kg−1 bolus plus 0.06 mg·kg−1·h−1 infusion, and 0.25 mg·kg−1 bolus plus 0.20 mg·kg−1 infusion). Flumazenil and α5IA data are from two and three separate studies respectively. For presentation purposes, all curves have been normalized so each condition can be presented in the same plot. In these examples, the inhibition of radiotracer binding by α5IA at steady state was 38% and 71%, for the 0.075 mg·kg−1 bolus plus 0.06 mg·kg−1·h−1 infusion and 0.25 mg·kg−1 bolus plus 0.20 mg·kg−1 infusion dosing regimes respectively. The time–activity curve for flumazenil (1 mg·kg−1) is included to show the extent of the non-specific radiotracer signal. The fit of the accumulation of radiotracer (solid grey line) suggests steady state was approximated prior to injection of α5IA chase. α5IA, 3-(5-methylisoxazol-3-yl)-6-[(1-methyl-1,2,3-triazol-4-yl)methyloxy]-1,2,4-triazolo[3,4-a]phthalazine.