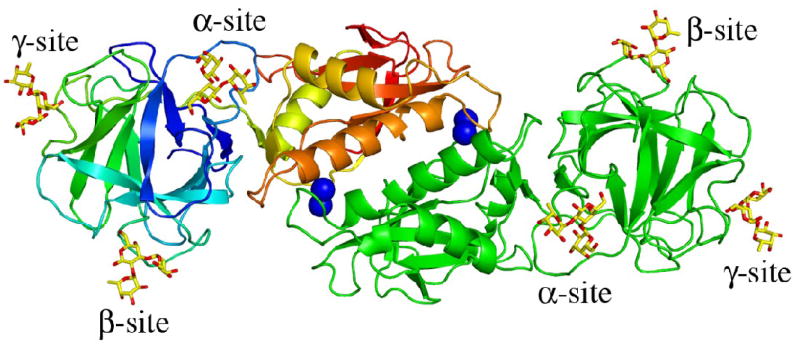
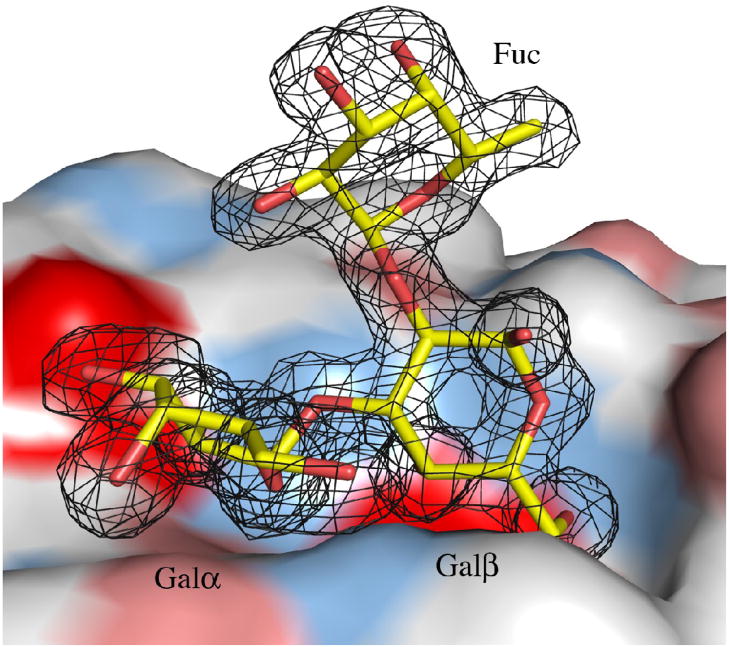
Figure 1.
MOA in complex with the blood group B determinant. (a) Schematic representation of the MOA homodimer. One protomer is colored green and the other changing color from blue at the N-terminus to red at the C-terminus. The four calcium ions bound as binuclear centers at the dimer interface are represented by dark blue spheres and the bound blood group B trisaccharide molecules as yellow stick-models. (b) The surface of the γ-site is depicted together with the trisaccharide Galα(1,3)[Fucα(1,2)]Gal shown as a stick-model. The final 2FO−FC electron density map (contoured at 1.0σ) is shown for the carbohydrate. The protein surface is colored red for negative charges, white for hydrophobic residues, light blue for polar nitrogens and pink for polar oxygens. All figures were made using PyMoL [http://pymol.sourceforge.net/].


