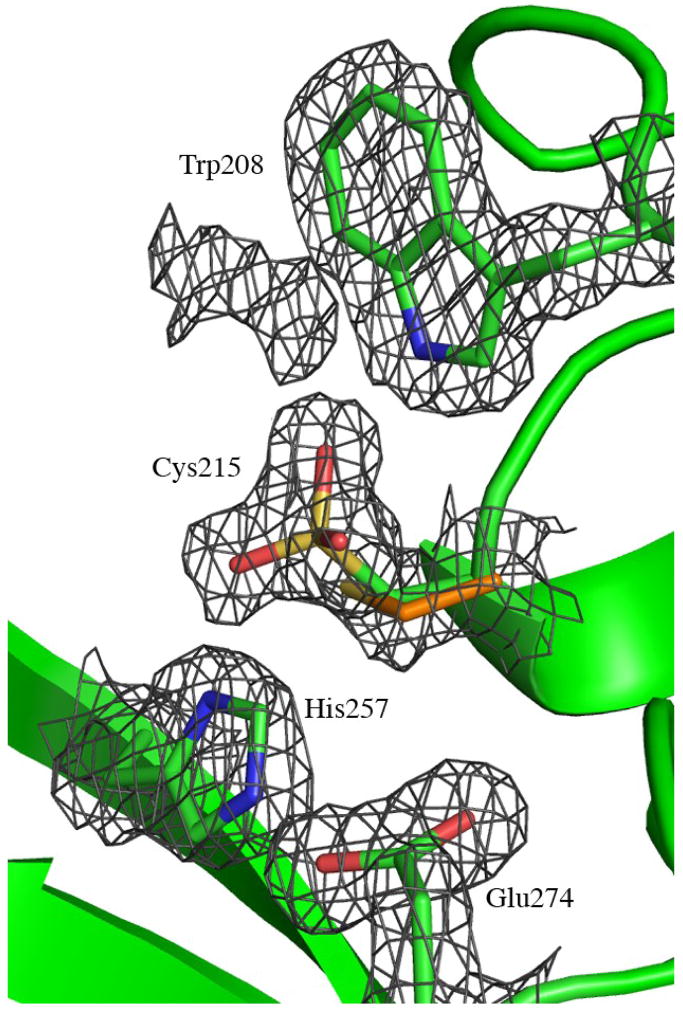
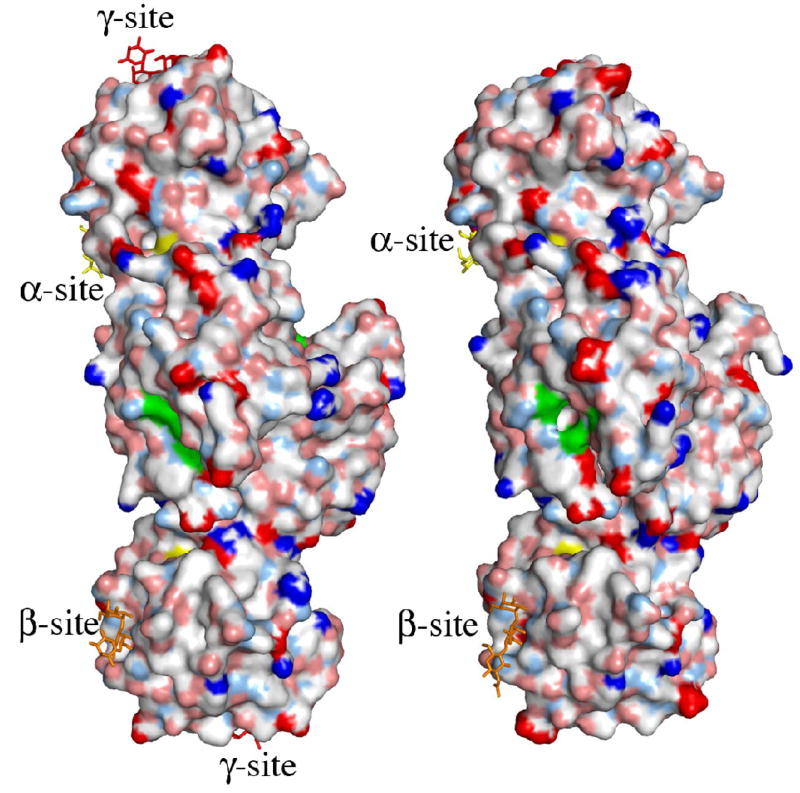
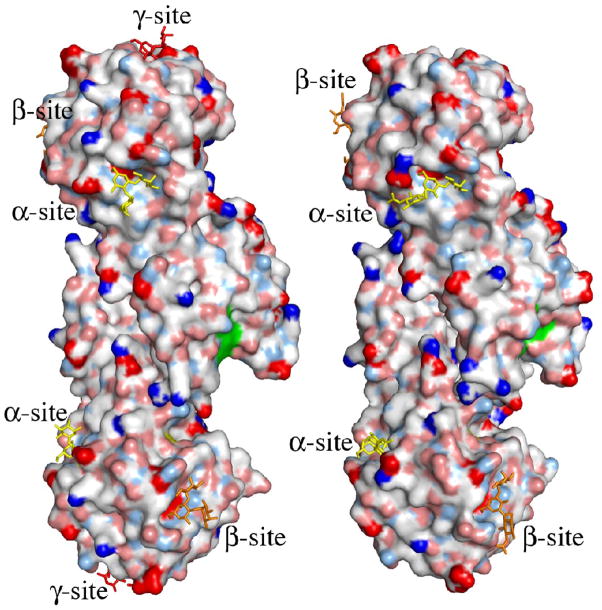
Figure 4.
The putative active site of MOA. (a) Close-up view featuring the potential catalytic triad (residues Cys215, His257 and Glu274). The electron density map (final 2FO−FC map contoured at 1.0 σ) is shown for the protein side chains. Cys215 is oxidized in about 50% of the molecules in the crystal and depicted are both the oxidized form (green carbons) and the reduced form (orange carbons). The side chain of Trp208 and the unassigned electron density adjacent to it are also shown in this picture. (b)–(c) Surface representation of the MOA dimers, to the left the blood group B determinant complex (Ca2+ bound) and to the right the xenotransplantation epitope complex (no Ca2+ bound). Coloring scheme for the protein surface: positive charge (blue), negative charge (red), hydrophobic (white), polar N (light blue), polar O (pink) and sulfurs (yellow). The potential catalytic triad is highlighted in green and the trisaccharides are colored yellow, orange and red when bound to the α-, β- and γ-site, respectively. (b) and (c) represent two alternative views, related to each other by a 90° rotation around a vertical axis.


