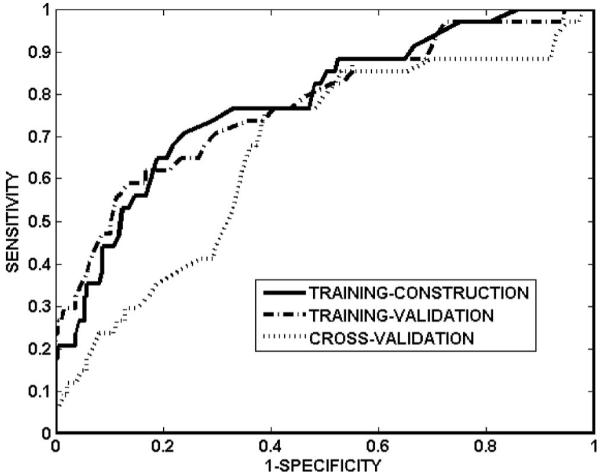
Fig. 4.

ROC curves of network NNdose on training-construction data, training-validation data, and cross-validation data. The corresponding areas under the ROC curves are 0.78, 0.77, and 0.67, respectively.

ROC curves of network NNdose on training-construction data, training-validation data, and cross-validation data. The corresponding areas under the ROC curves are 0.78, 0.77, and 0.67, respectively.